EMQX is the world’s leading open-source distributed MQTT broker with high performance and high availability. Its latest version, EMQX 5.0, has been verified to scale to 100 million concurrent MQTT connections and is the first broker to introduce QUIC to MQTT.
In this article, we will introduce how to build an MQTT Dashboard to monitor EMQX 5.0 with Prometheus and use Grafana to visualize its data metrics. In addition, we will introduce EMQX Exporter to expose metrics that are not included in the Prometheus API. It is compatible with EMQX 4.4 and EMQX 5, both open-source and enterprise.
Build a Powerful MQTT Dashboard
In addition to the built-in Dashboard, EMQX provides APIs to integrate monitoring data into third-party monitoring platforms. You can integrate EMQX with third-party monitoring systems to:
Combine monitoring of EMQX with the monitoring of other related systems to form a complete view of your workflow;
Use easy-to-read charts and graphs to display data more intuitively, such as using Grafana;
Use Prometheus's Alertmanager to get alerts when something goes wrong.
Call Flow of Metric Data Collection
The figure below shows the call flow when Prometheus collects metric data.
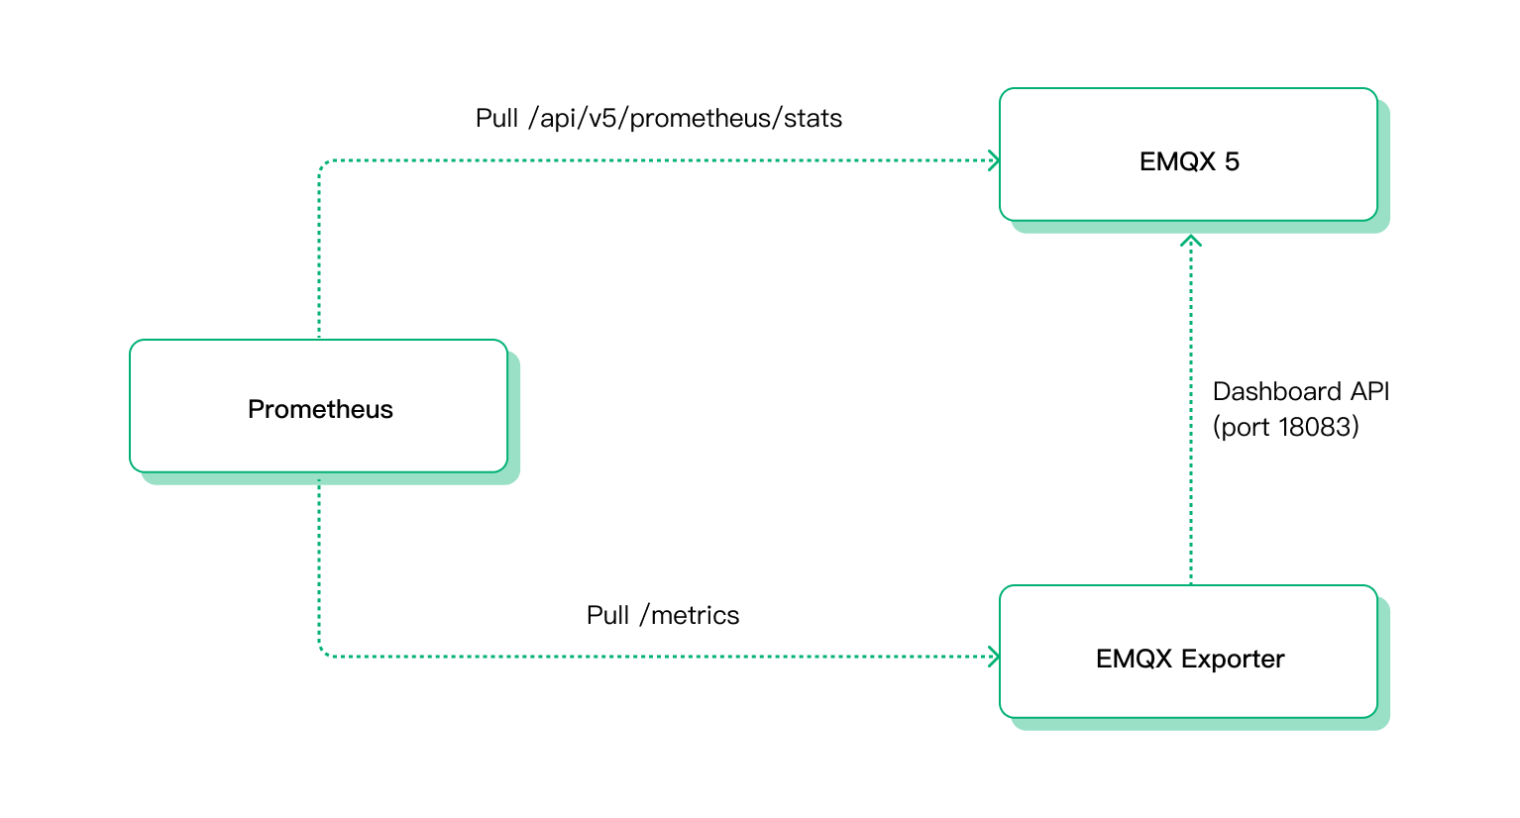
First, Prometheus collects basic monitoring metrics directly from the API interface /api/v5/prometheus/stats provided by EMQX.
Second, Prometheus collects monitoring metrics from the API interface /metrics provided by EMQX Exporter. Then EMQX Expoter will call EMQX's Dashboard API to obtain additional runtime data and return it to Prometheus.
Preparation
Before we get started, we need to:
Prepare the running environment, install and run EMQX 5.0;
Prepare the installation package of Prometheus;
Install and start Grafana.
You can also download the installation or binary package using the download address provided in the article and install it yourself. In the example, we will use Docker to install and activate.
Install EMQX 5.0
You can quickly install and start EMQX 5.0 by using Docker:
docker run -d --name emqx -p 1883:1883 -p 8083:8083 -p 8883:8883 -p 8084:8084 -p 18083:18083 emqx/emqx:5.0.2
In addition to Docker, you can also use RPM or DEB packages to install EMQX. For specific installation methods, please refer to EMQX 5.0 Installation Guide.
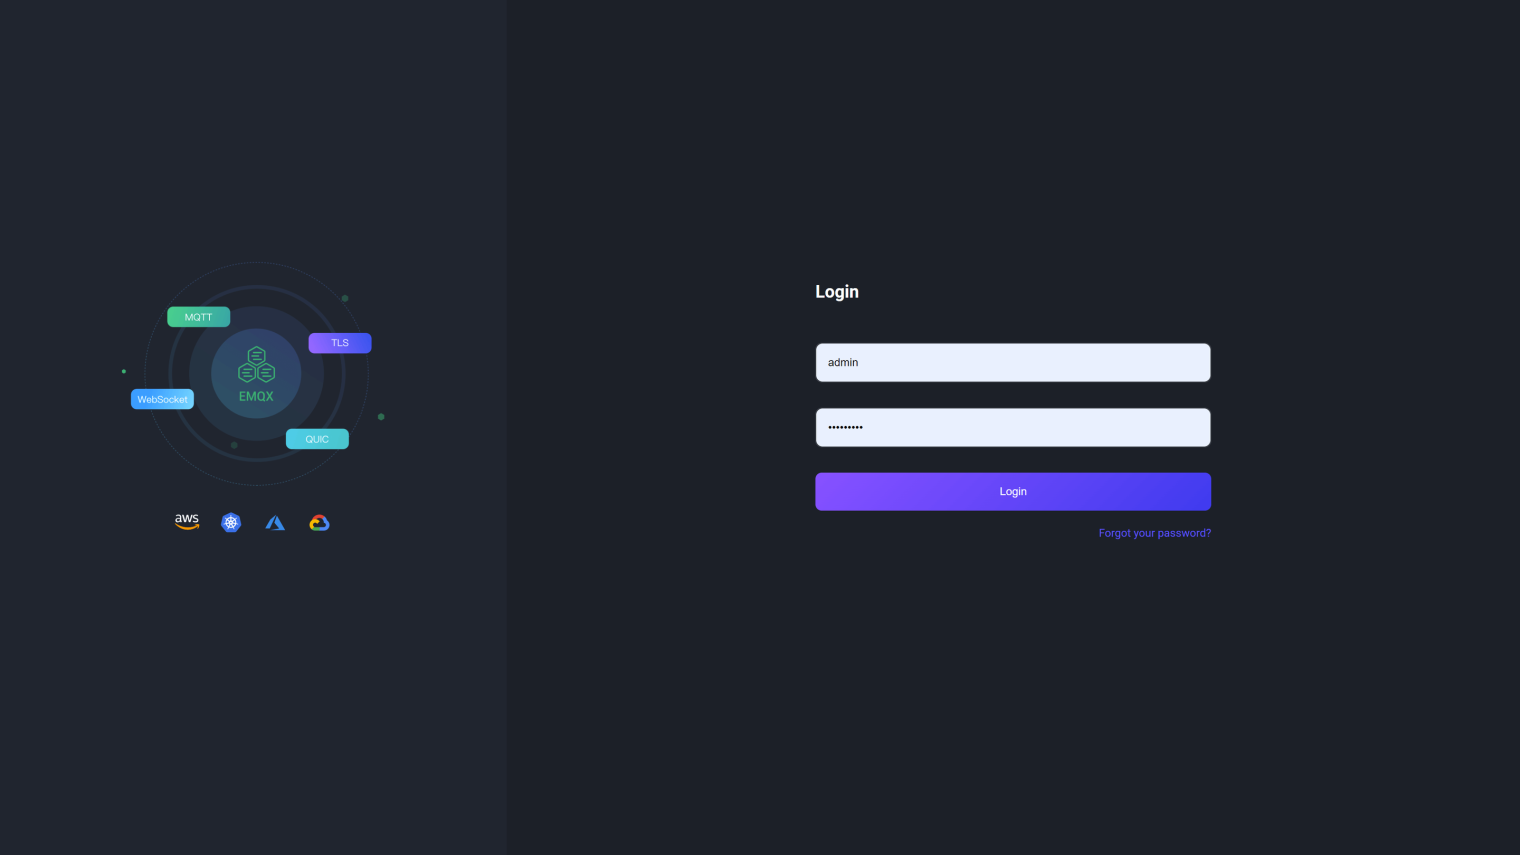
After the installation, you can open <http://localhost:18083> to access the EMQX Dashboard to view the running status. If you can access it, usually, EMQX has been installed successfully.
The default username and password is admin/public.
Install EMQX Exporter
Install EMQX Exporter is required. It collects partial metrics of EMQX cluster and other info, such as license, rule engines, authentication, ACL, etc.
EMQX Exporter requires access to the EMQX dashboard API with basic auth, so we need to sign in to the Dashboard to create an API Key, then pass the API key and secret to the startup argument as username and password.
docker run -d \
  -p 8085:8085 \
  --name emqx-exporter \
  emqx-exporter:latest \
  --emqx.nodes="${your_eth_addr}:18083"  \
  --emqx.auth-username="${paste_your_new_api_key_here}" \
  --emqx.auth-password="${paste_your_new_secret_here}"
Note: The arg
emqx.nodesis a comma-separated list of host, the exporter will choose one to establish connection. It shoud be the actual IP address of the service you deployed, and couldn’t belocalhostor127.0.0.1
Use the cmd below to see the log of container:
docker logs emqx-exporter
If the EMQX version information is printed in the log, it means that EMQX Exporter has successfully accessed the Dashboard API.
ts=2023-05-26T10:50:27.034Z caller=main.go:136 level=info msg="Starting emqx-exporter" version="(version=, branch=, revision=unknown)"
ts=2023-05-26T10:50:27.034Z caller=main.go:137 level=info msg="Build context" build_context="(go=go1.19.3, platform=linux/amd64, user=, date=, tags=unknown)"
ts=2023-05-26T10:50:27.035Z caller=main.go:60 level=info msg="Enabled collectors"
ts=2023-05-26T10:50:27.035Z caller=main.go:67 level=info collector=authentication
ts=2023-05-26T10:50:27.035Z caller=main.go:67 level=info collector=authorization
ts=2023-05-26T10:50:27.035Z caller=main.go:67 level=info collector=cluster
ts=2023-05-26T10:50:27.035Z caller=main.go:67 level=info collector=license
ts=2023-05-26T10:50:27.035Z caller=main.go:67 level=info collector=messages
ts=2023-05-26T10:50:27.035Z caller=main.go:67 level=info collector=rule
ts=2023-05-26T10:50:27.035Z caller=tls_config.go:232 level=info msg="Listening on" address=[::]:8085
ts=2023-05-26T10:50:27.035Z caller=tls_config.go:235 level=info msg="TLS is disabled." http2=false address=[::]:8085
ts=2023-05-26T10:50:27.039Z caller=cluster.go:71 level=info ClusterVersion=5.0.2-OpenSource
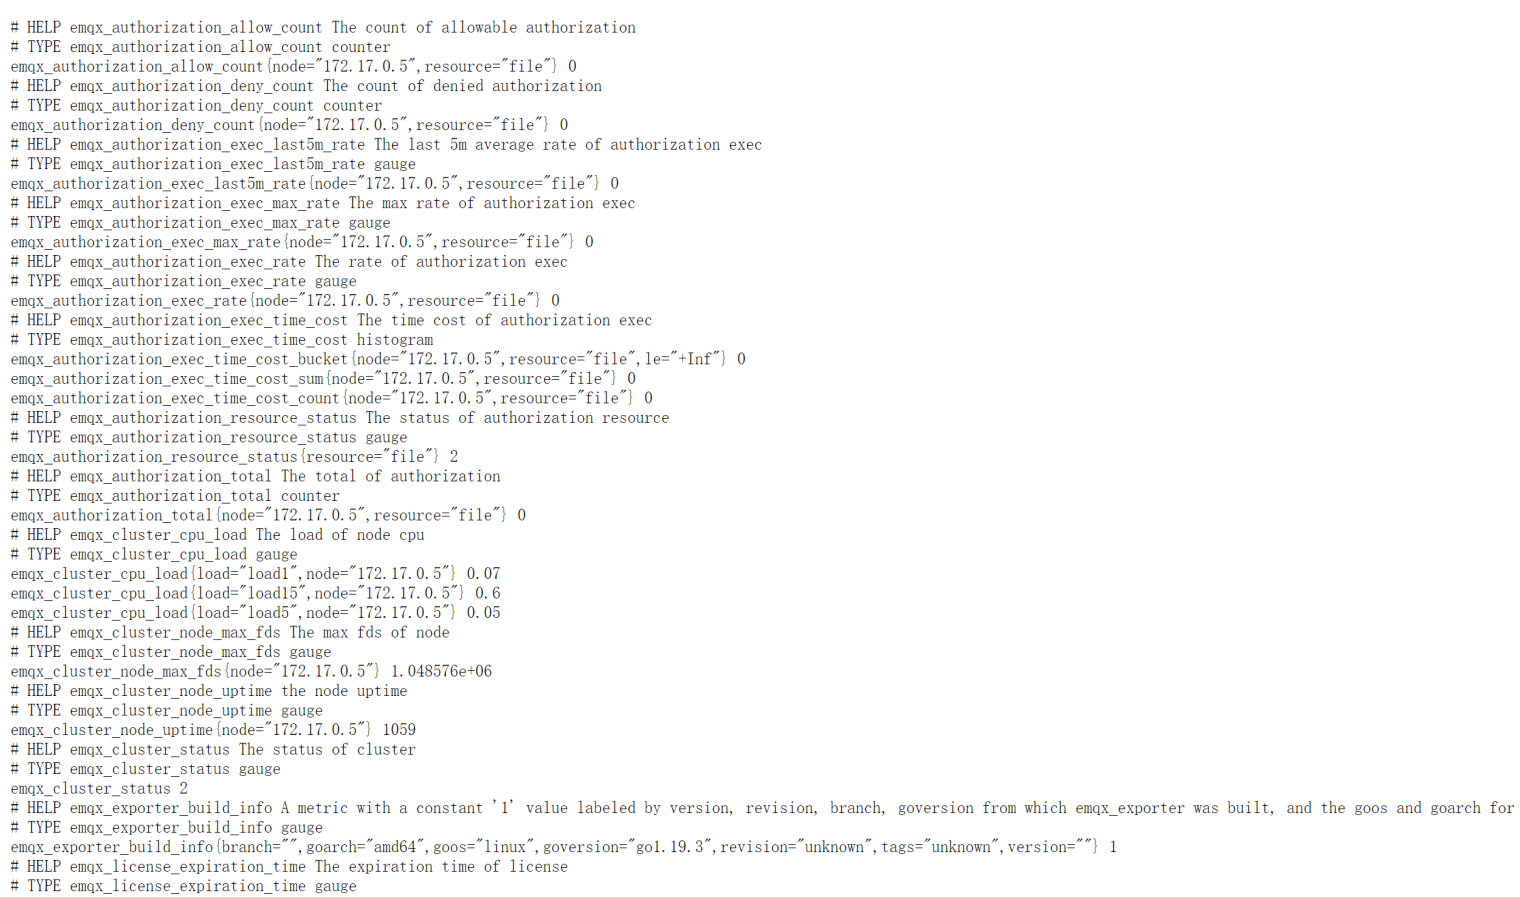
In addition, we can access the monitoring data of EMQX through <http://localhost:8085/metrics>.
Install Node Exporter
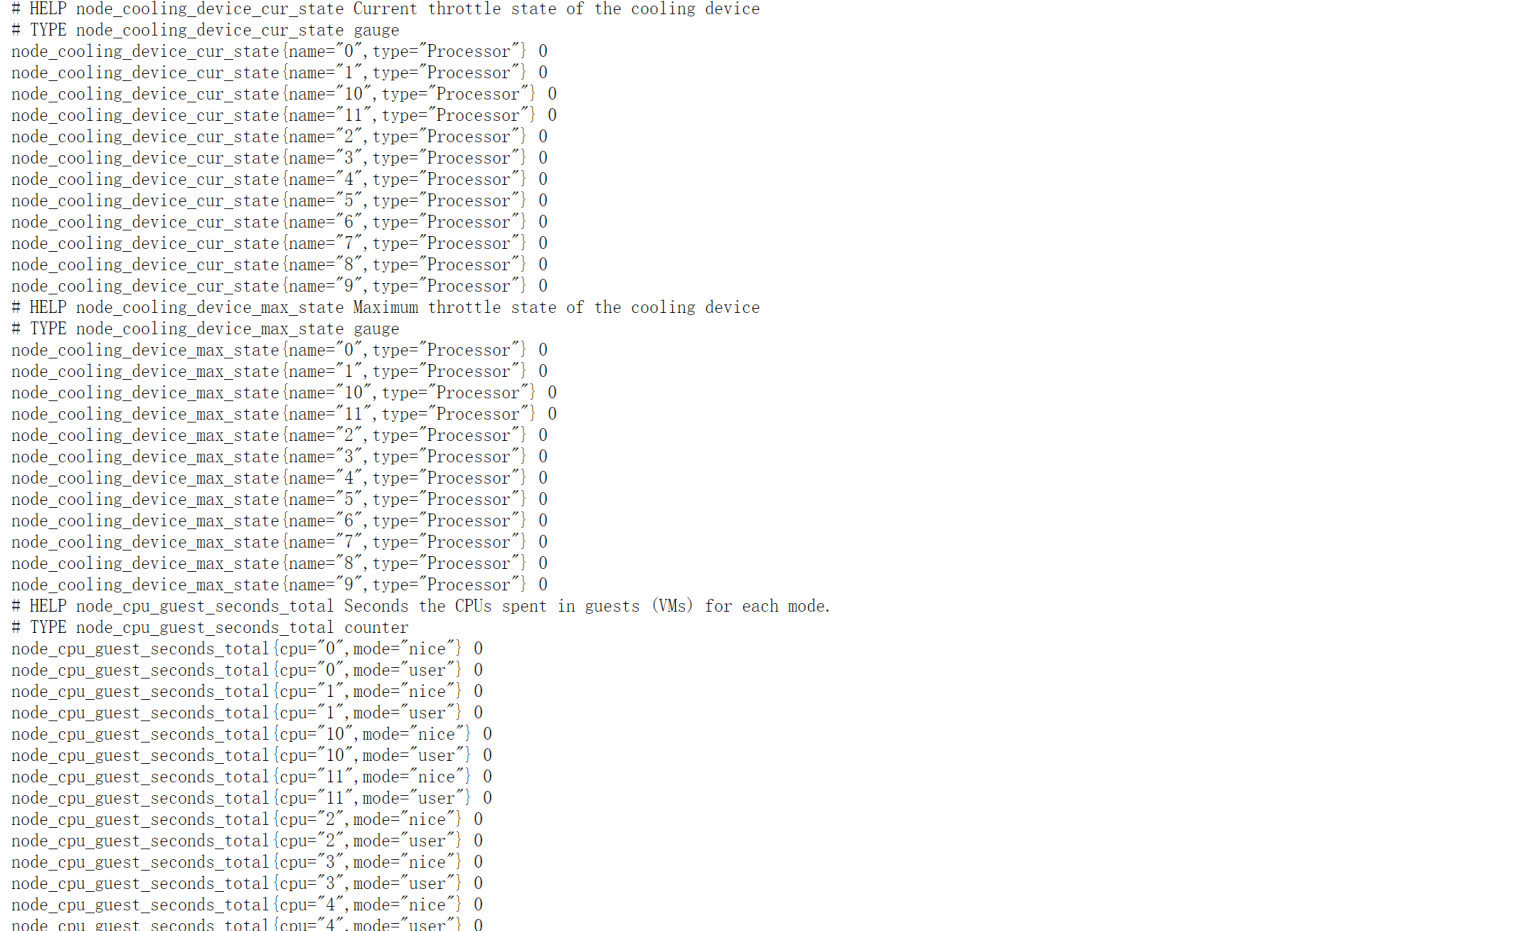
It is optional if you want to monitor the system information of physical machines or VM. Node Exporter collects monitoring data of the server, such as CPU, memory, disk, network, etc.
It's not recommended to use Docker to install Node Exporter in this article. For the installation and use of Node Exporter, please refer to Node Exporter Official Document. After the installation, if we can access the monitoring data of the system host through <http://localhost:9100/metrics\>, it means that Node Exporter has been installed successfully.
Install Prometheus
In the same way, we will use Docker to quickly install and use Prometheus in the example.
Prometheus is an open-source monitoring and alerting solution developed by SoundCloud, which supports a multi-dimensional data model, flexible query language, powerful alert management, and other features. Grafana is an open-source data visualization tool that helps multiple data sources, including Prometheus.
Configure Prometheus Data Collection
Prometheus uses the configuration file to specify the target of data collection. The default configuration file path is /etc/prometheus/prometheus.yml.
EMQX 5.0 provides an HTTP API to get Prometheus format monitoring data -- /api/v5/prometheus/stats, which does not require authentication information. We only need to configure it to the metrics_path in the configuration file.
For using Node Exporter to get the monitoring data of the host, we also need to configure the address of the Node Exporter service to the static_configs in the configuration file.
In the Prometheus configuration file, specify the data collection target through scrape_configs. The following is the complete Prometheus configuration file content example:
Note: When using the configuration file, you need to replace the IP address in the targets of each service with the actual IP address of the service you deployed.
global:
  scrape_interval: 10s

scrape_configs:
  - job_name: 'emqx'
    metrics_path: /api/v5/prometheus/stats
    scrape_interval: 5s
    honor_labels: true
    static_configs:
      # EMQX IP address and port
      - targets: [${your_eth_addr}:18083]
        labels:
          # user-defined cluster name, requires unique
          cluster: emqx5
          # fix value, don't modify
          from: emqx
  - job_name: 'emqx-exporter'
    metrics_path: /metrics
    scrape_interval: 5s
    static_configs:
      - targets: [${your_eth_addr}:8085]
        labels:
          # user-defined cluster name, should be the same as the cluster name above
          cluster: emqx5
          # fix value, don't modify
          from: exporter
  - job_name: 'node-exporter'
    scrape_interval: 5s
    static_configs:
      # node-exporter IP endpoint
      - targets: [${your_eth_addr}:9100]
        labels:
          instance: dashboard-local
In the above configuration, the descriptions of some configuration items are as follows:
job_name The task name of data collection.
targets The target data collection address list.
cluster User-defined cluster name, the cluster label of both 'emqx' and 'emqx-exporter' requires consistent to indicate that they belong to a same cluster. The name of different cluster must ensure uniqueness。
from Used to distinguish the source of metrics data, keep default and do not modify。
We save the above configuration file content as prometheus.yaml in the custom path where you need to keep the file. At this point, we have completed the configuration of Prometheus.
Start Prometheus
After completing the configuration of Prometheus, we can start the Prometheus service by using the file. If you have downloaded the Prometheus image using Docker, you can start Prometheus with the following command:
docker run -d --name prometheus -p 9090:9090 -v /path/to/your/prometheus.yaml:/etc/prometheus/prometheus.yaml prom/prometheus
Note: You need to replace
/path/to/your/prometheus.yamlwith the actual path where you store the Prometheus configuration file.
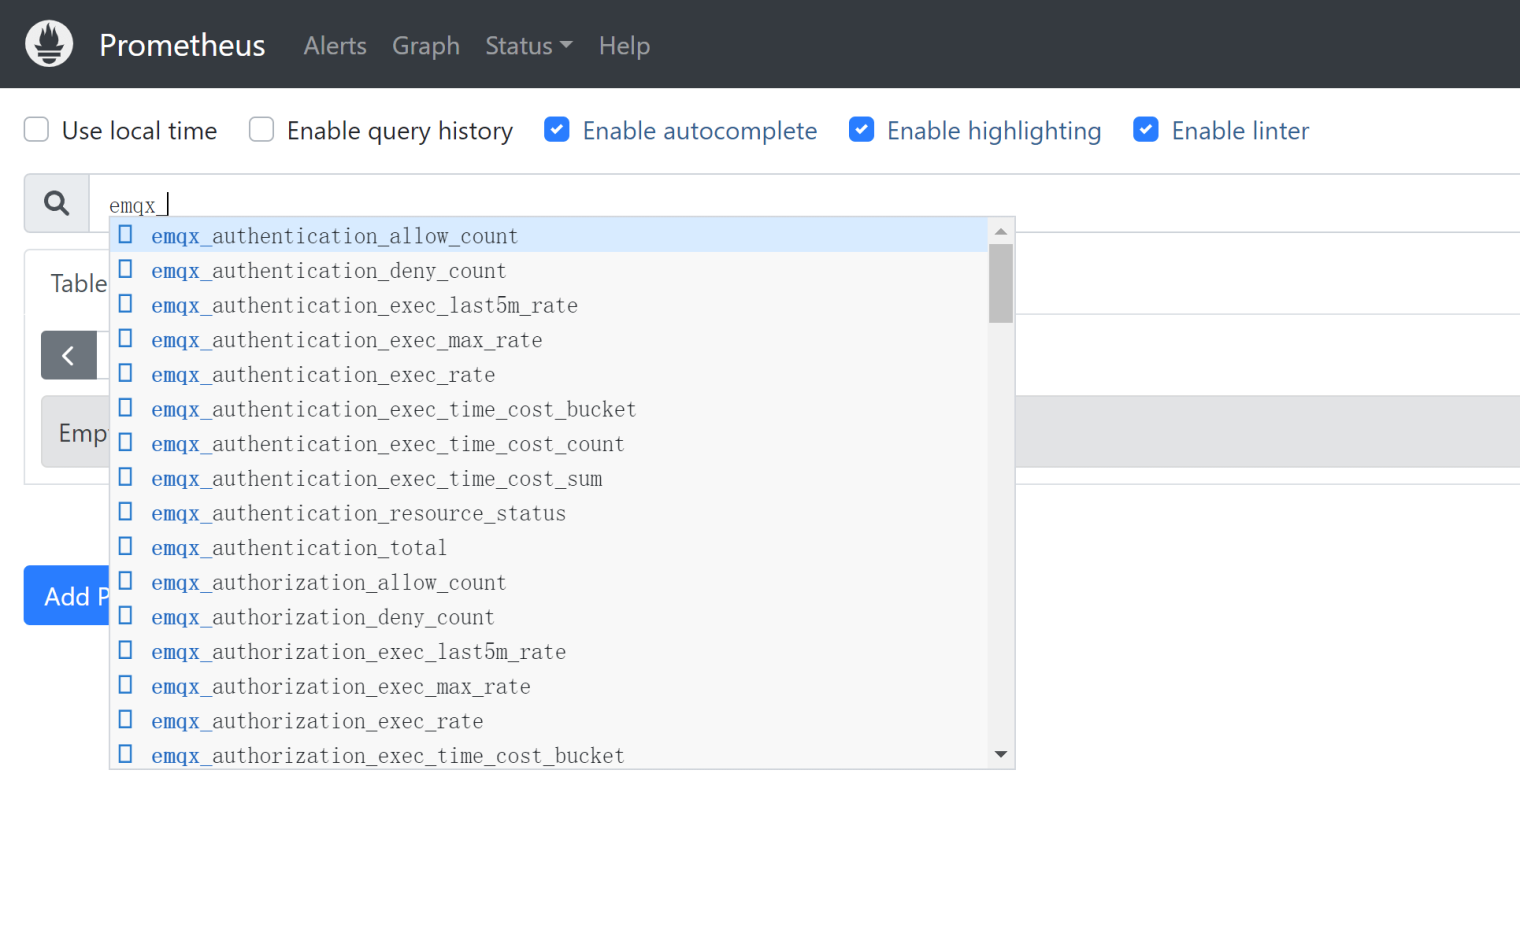
If successful, you can access the Prometheus Dashboard by opening localhost:9090. Through the Dashboard, you can view the running status of Prometheus and search for EMQX's monitoring data by entering emqx. If the data is displayed, Prometheus has successfully started and collected EMQX's monitoring data.
Install Grafana
Below is the way to quickly install and start Grafana by using Docker:
docker run -d --name grafana -p 3000:3000 grafana/grafana:9.3.2
After Grafana installation, we can open <http://localhost:3000\> to access Grafana.
The default username and password is admin/admin.

After configuring Prometheus to collect data metrics of EMQX, we can use Grafana to visualize the monitoring of EMQX's metric data. In the above steps, we have successfully opened the Web console of Grafana. After logging in successfully, we can add the data source.
Add Prometheus as a Data Source
Click the
Configurationon the left, then clickData Sourcesto enter the data source configuration page;Click
Add data sourceand selectPrometheus;In the
HTTPconfiguration, enter the address of the Prometheus service, for example,<http://${your_eth_addr}:9090;>Finally, click
Save & Test. If the configuration is correct, it will displayData source is working, which means the configuration is successful.
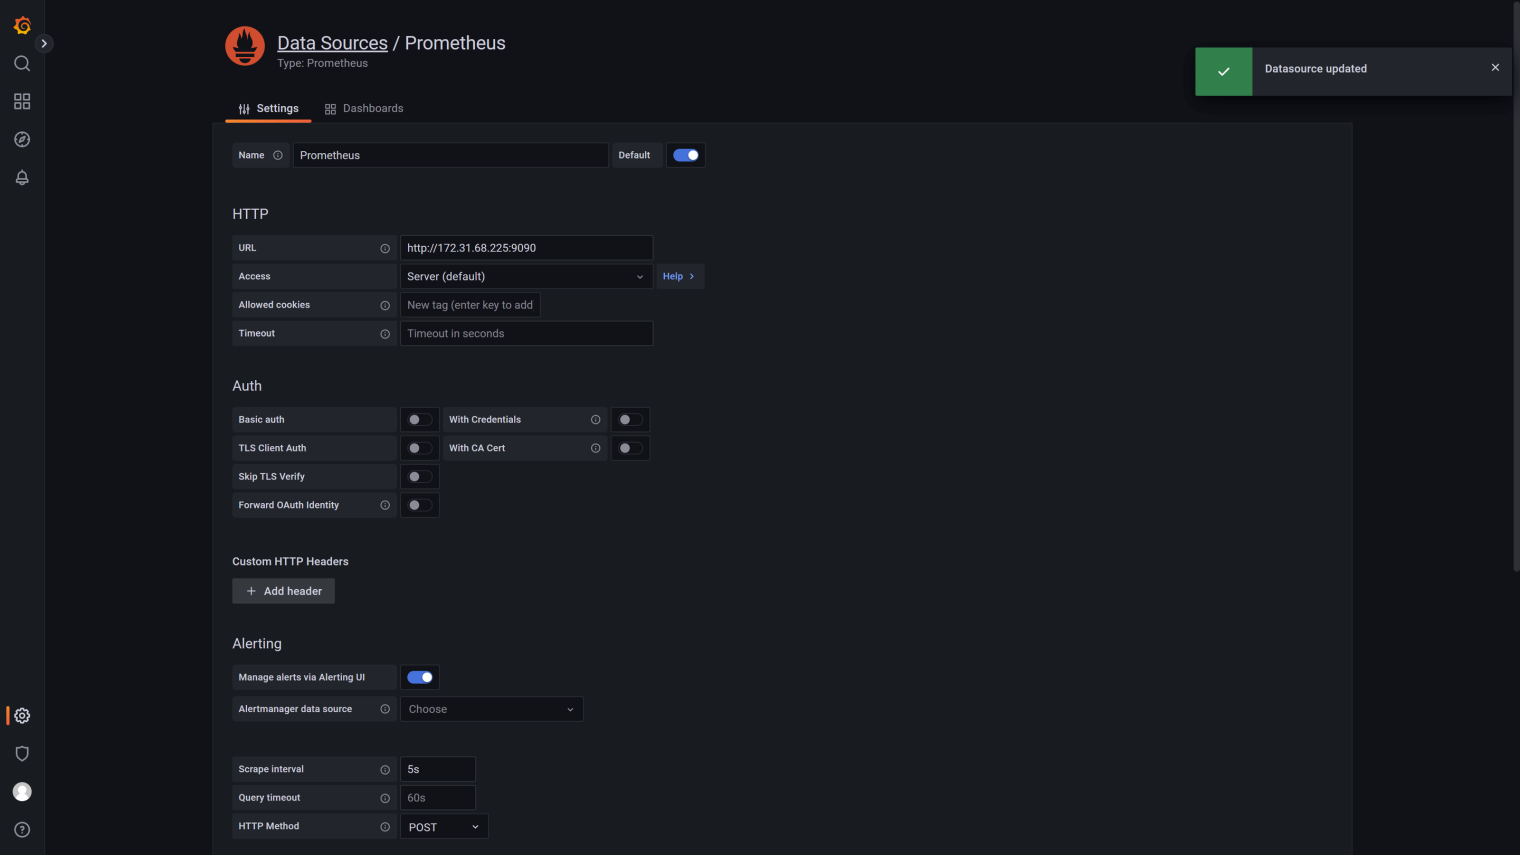
After the configuration is completed, we can use Prometheus as a data source to get monitoring data in Grafana. Next, we can continue to add the Dashboard template to visualize the monitoring of EMQX's data metrics. You can also manually create a Dashboard and add charts according to your needs.
Import Dashboard
We provide a default Grafana Dashboard template that You can directly import into Grafana and select the newly created Prometheus data source. After the import is successful, open the Dashboard panel, and you can see the monitoring data of EMQX.
You can download default Dashboard templates from Templates.
The specific import steps are as follows:
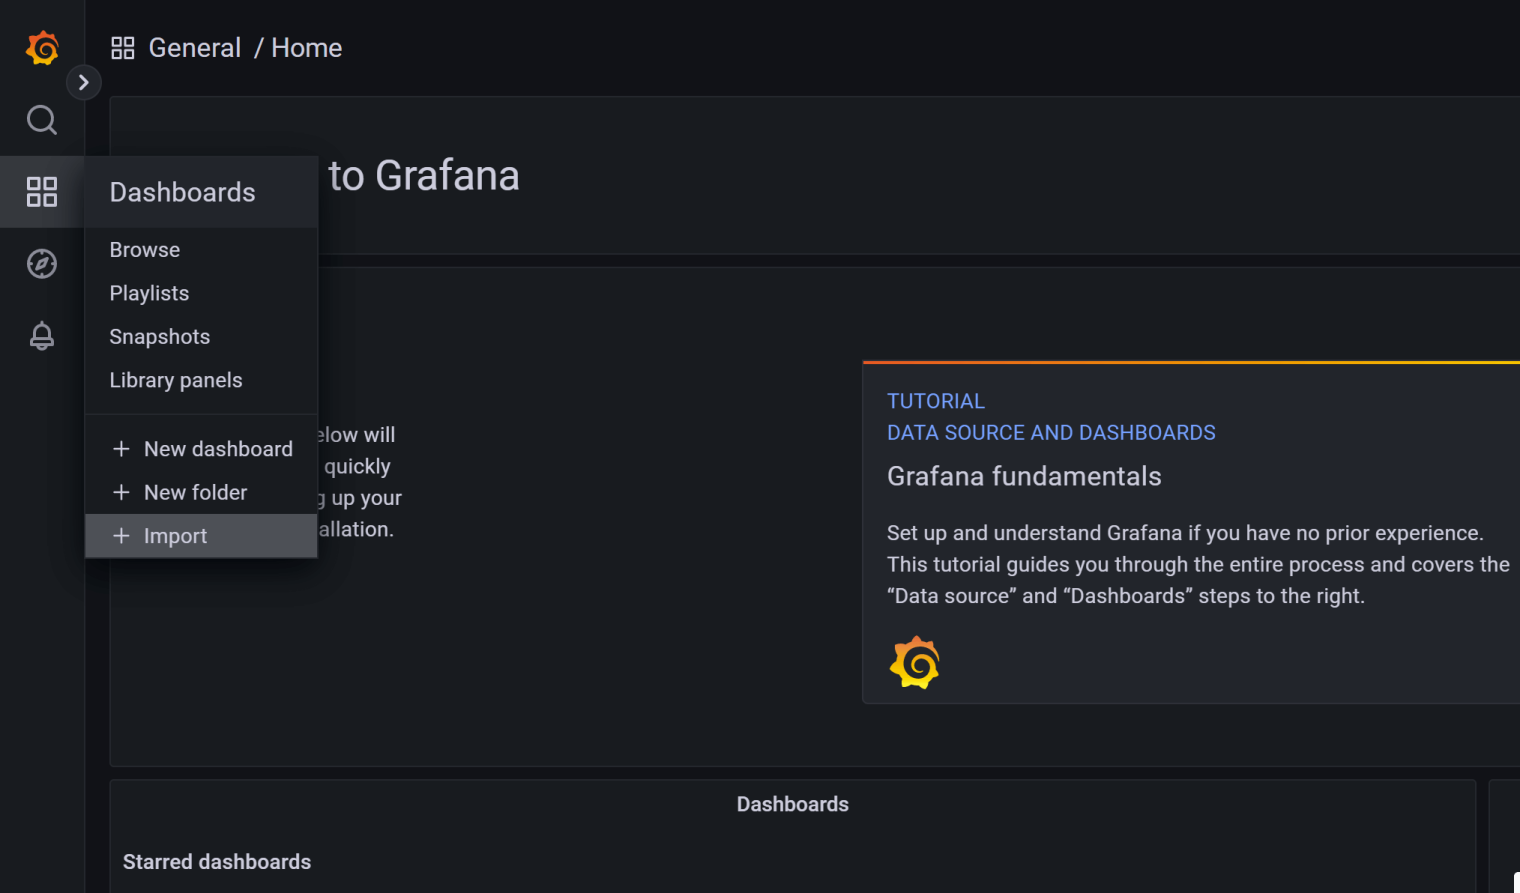
Click
Upload JSON fileand select the dashboard template that was just downloaded.Click
ImportRepeat the steps above to import othter templates.
After importing all templates, you can see monitoring data from EMQX in the EMQX dashboard, as shown below:
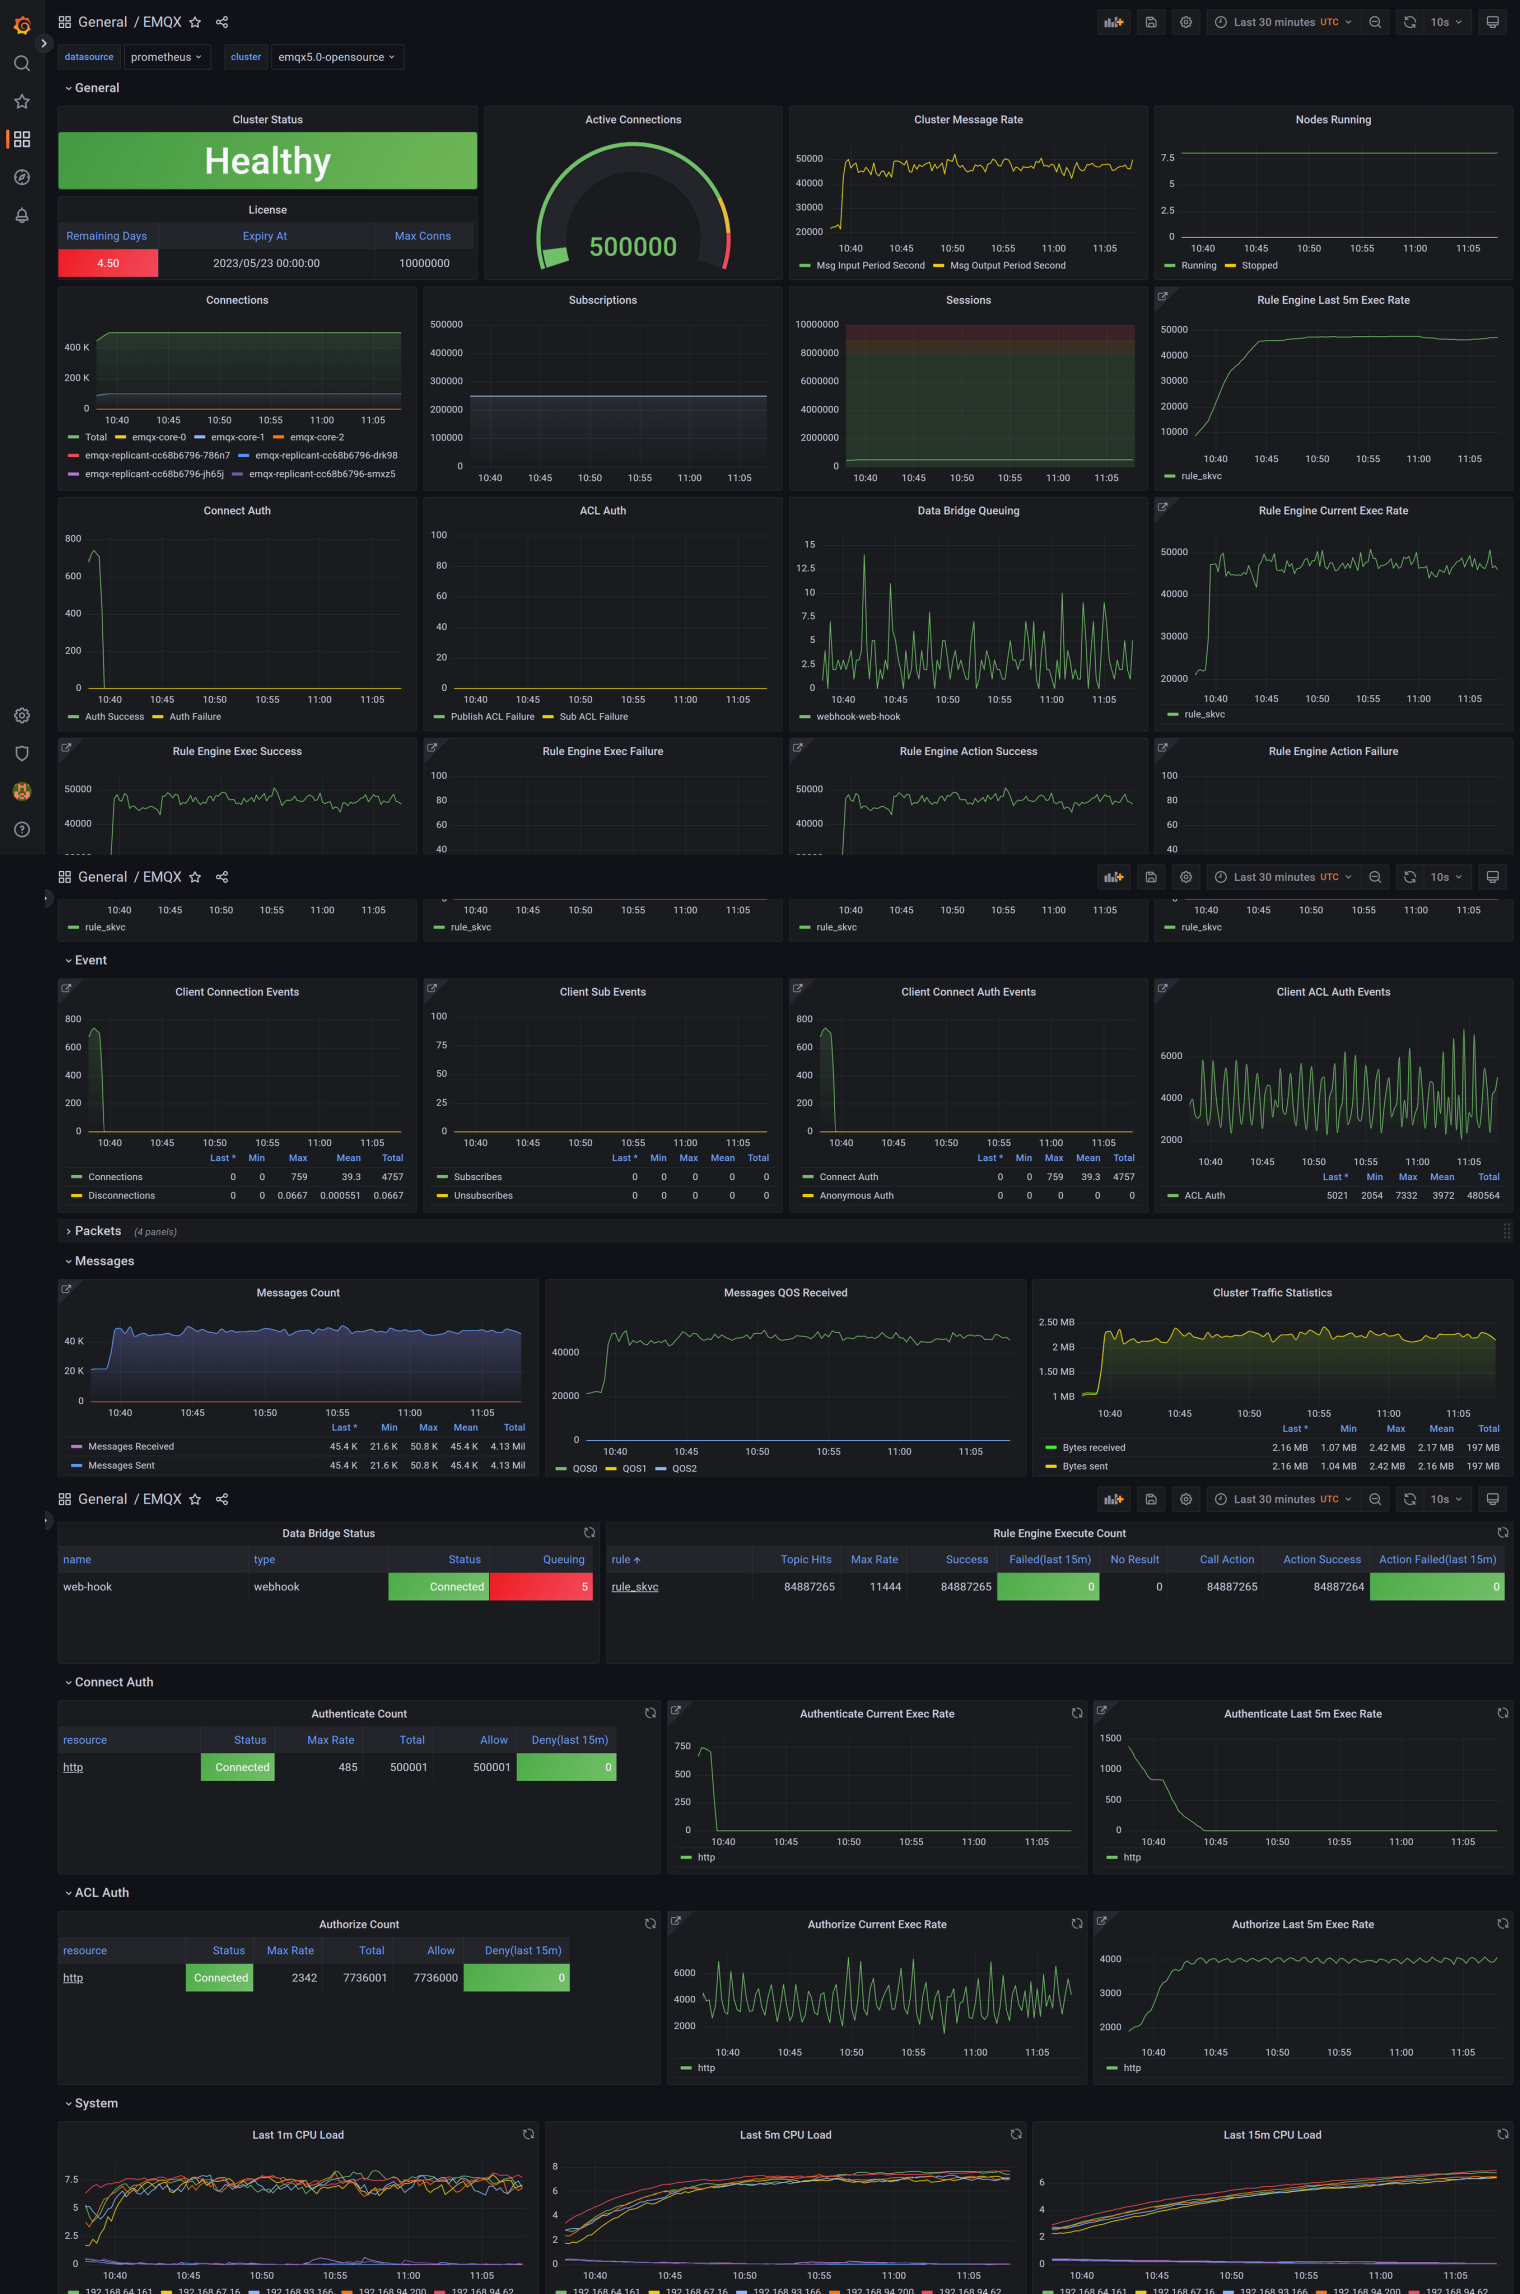
Note: By default, the template will monitor the metric data of the entire EMQX cluster.
Conclusion
This article introduces how to build an MQTT Dashboard with EMQX, Prometheus and Grafana. Based on EMQX built-in Dashboard, we integrate Prometheus to collect the data metrics of EMQX 5.0 and Grafana to visualize the monitoring data metrics on Docker.
Check out the repo EMQX Exporter to learn how to monitor EMQX in other environments.
To learn more about the data metrics you can query, see our Metrics and Stats document. For pricing and other questions, feel free to reach out to our team.
