Monitoring MQTT broker with Prometheus and Grafana
We will introduce how to integrate the monitoring data of EMQX 5.0 into Prometheus, and use Grafana to display the monitoring data of EMQX.
EMQX is a scalable and popular open-source MQTT broker with a high performance that connects 100M+ IoT devices in 1 cluster at 1ms latency. It can move and process millions of MQTT messages per second. The EMQX 5.0 has been verified in test scenarios to scale to 100 million concurrent device connections and is the first product to introduce QUIC to MQTT.
When using EMQX, it is necessary for users, operators, and developers to monitor and observe the running status and metrics of it in time to find problems and deal with them. In addition to using the built-in Dashboard, EMQX also provides APIs to integrate monitoring data into third-party monitoring platforms to monitor the running status of EMQX, including cluster node status, connections, subscriptions and topics, message throughput, and other related metrics.
Using third-party monitoring systems can monitor EMQX more conveniently. For example:
Integrate the monitoring data of EMQX with the monitoring data of other systems to form a complete monitoring system, such as the related information of the server host;
Using more rich monitoring charts to display monitoring data more intuitively, such as using Grafana;
Using more rich alert methods to find problems more timely, such as using Prometheus's Alertmanager.
In this article, we will introduce how to integrate the monitoring data of EMQX 5.0 into Prometheus, use Grafana to display the monitoring data of EMQX, and finally build a simple EMQX monitoring system.
Prometheus is an open-source monitoring and alerting solution developed by SoundCloud, which supports a multi-dimensional data model, flexible query language, powerful alert management, and other features. Grafana is an open-source data visualization tool that helps multiple data sources, including Prometheus.
Preparation
Before starting, we need to prepare the following running environment, install and run EMQX 5.0, prepare the installation package of Prometheus, and install and start Grafana. Users can also download the installation or binary package according to the download address provided in the article and install it themselves. In the example, we will use Docker to install and activate.
Install EMQX 5.0
Following is the way to quickly install and start EMQX 5.0 by using Docker:
docker run -d --name emqx -p 1883:1883 -p 8083:8083 -p 8883:8883 -p 8084:8084 -p 18083:18083 emqx/emqx:latest
In addition to using Docker to install EMQX, we can also use RPM or DEB packages to install it. For specific installation methods, please refer to EMQX 5.0 Installation Guide.
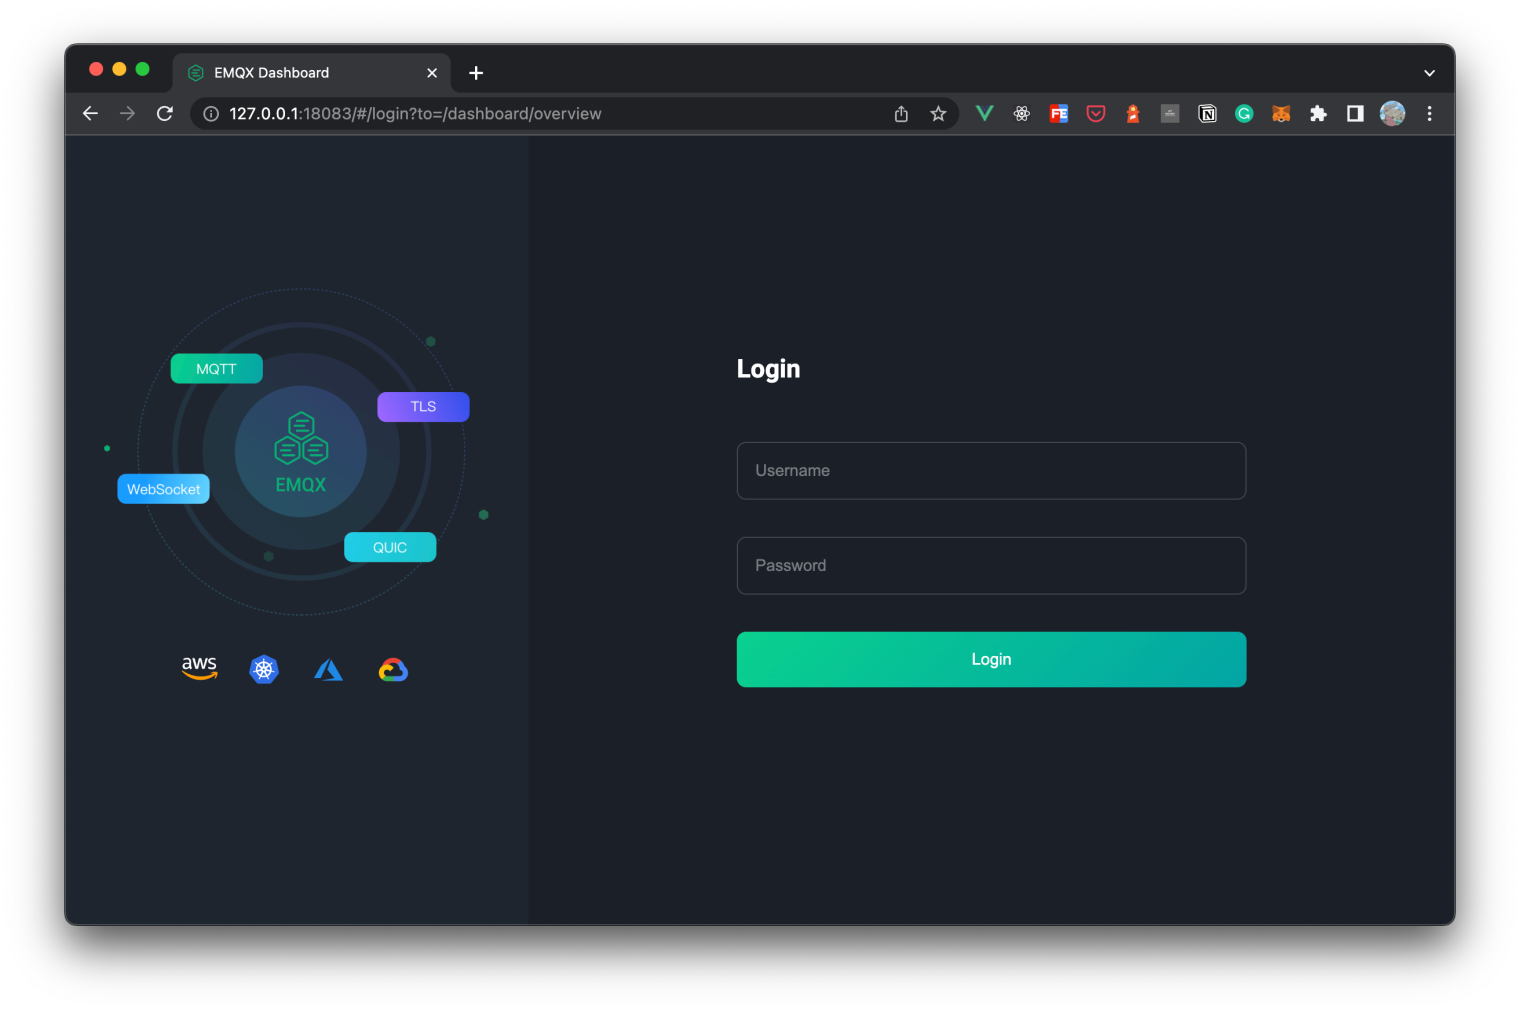
After the installation, we can open http://localhost:18083 to access the EMQX Dashboard to view the running status. If you can access it, usually, EMQX has been installed successfully.
Install Prometheus
In the same way, we will use Docker to quickly install and use Prometheus in the example because we have yet to start to configure Prometheus so that we can pull a Docker image provided by Prometheus.
docker pull prom/prometheus
Because after the installation, we need to configure a Prometheus configuration file to specify the data source of Prometheus, alert rules, and other scrap configs. Therefore, in the tutorial after the article, we will configure the Prometheus configuration file after the configuration is completed and then start it by mounting the configuration file to the container for running.
Users can also refer to the Prometheus document to download and use the binary package to install and run Prometheus.
Below is the way to quickly install and start Grafana by using Docker:
docker run -d --name grafana -p 3000:3000 grafana/grafana-oss
Users can also refer to the Grafana document to download and use the binary package to install and run Grafana.
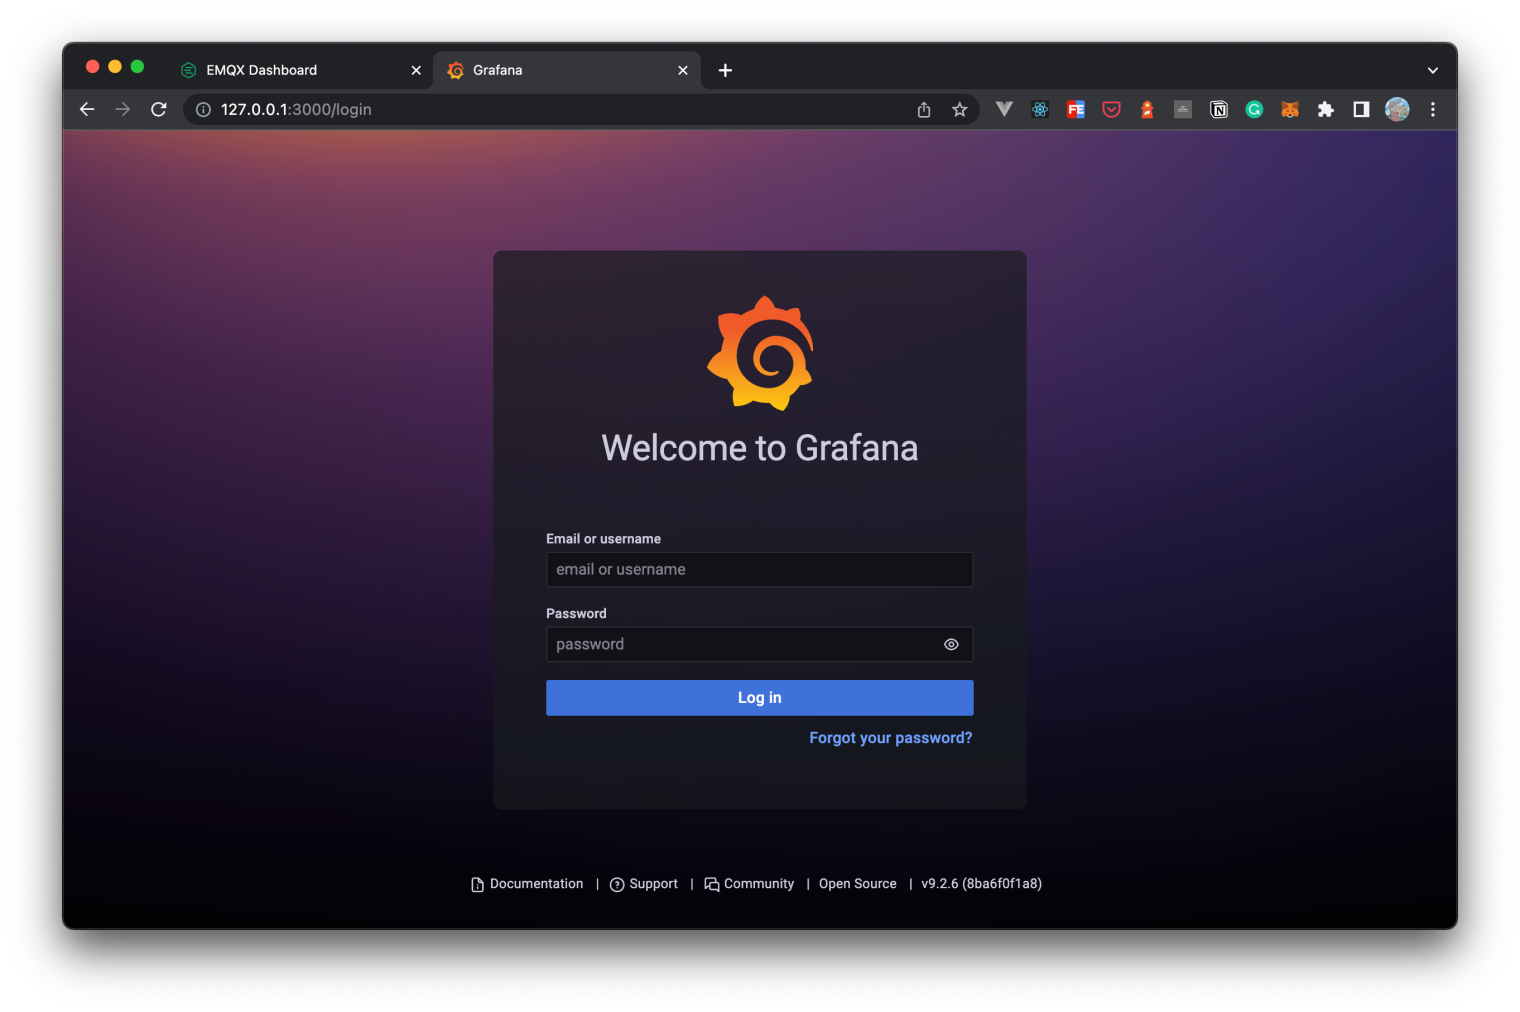
After Grafana installation, we can open http://localhost:3000 to access Grafana. If we can access the login page of Grafana usually, it means that Grafana started successfully.
Install Node Exporter
Install Node Exporter, optional if users want to monitor the system information of physical machines or VM. Node Exporter collects monitoring data of the server, such as CPU, memory, disk, network, etc.
Note: Node Exporter only supports the *nix systems
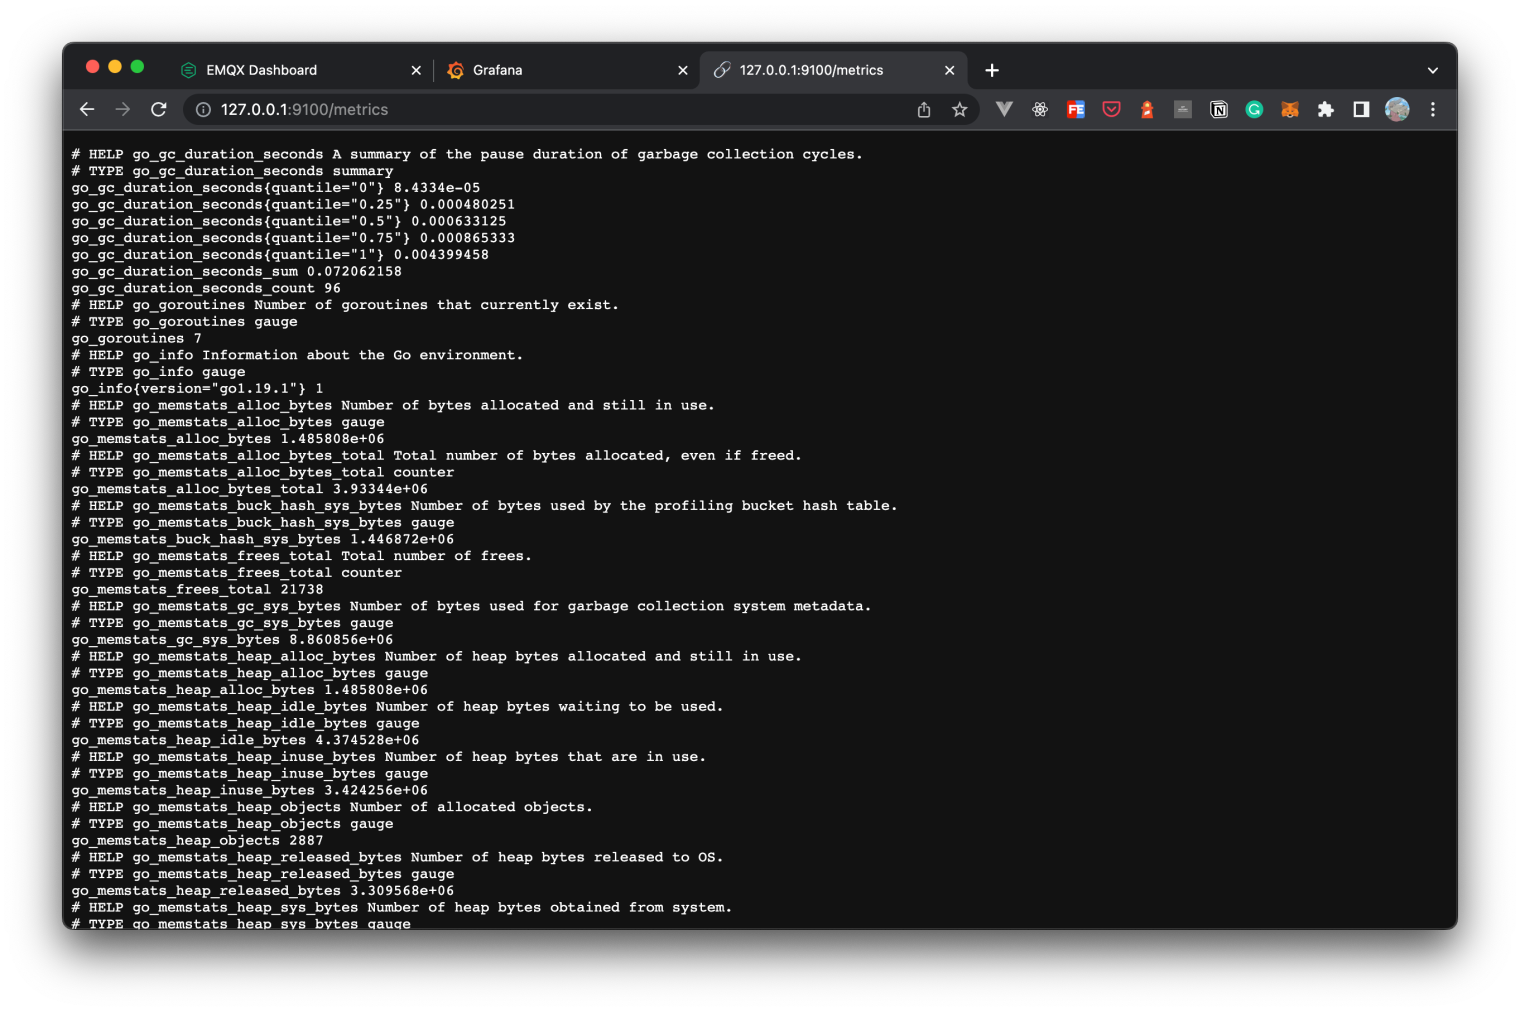
It's not recommended to use Docker to install Node Exporter in this article. For the installation and use of Node Exporter, please refer to Node Exporter Official Document. After the installation, we can access the monitoring data of the system host through http://localhost:9100/metrics. If we can access the monitoring data of the system host, it means that Node Exporter has been installed successfully.
Configure Prometheus
When we completed the preparation work, we needed to configure Prometheus so that it could generally collect the monitoring data of EMQX.
Configure Prometheus Data Collection
Prometheus uses the configuration file to specify the target of data collection. The default configuration file path is /etc/prometheus/prometheus.yml, which can be set by the --config.file parameter.
EMQX 5.0 provides an HTTP API to get Prometheus format monitoring data -- /api/v5/prometheus/stats, which does not require authentication information. We only need to configure it to the metrics_path in the configuration file.
For using Node Exporter to get the monitoring data of the host, we also need to configure the address of the Node Exporter service to the static_configs in the configuration file.
In the Prometheus configuration file, specify the data collection target through scrape_configs. The following is the complete Prometheus configuration file content example:
Note: When using the configuration file, you need to replace the IP address in the targets of each service with the actual IP address of the service you deployed. If you are using local deployment, you can ignore this reminder.
# prometheus.yaml
global:
  scrape_interval: 10s # The default scrape interval is every 10 seconds.
  evaluation_interval: 10s # The default evaluation interval is every 10 seconds.
  # On this machine, every time series will be exported by default.
  external_labels:
    monitor: 'emqx-monitor'
# Load rules once and periodically evaluate them according to the global 'evaluation_interval'.
rule_files:
  # - "first.rules"
  # - "second.rules"
  - "/etc/prometheus/rules/*.rules"
# Data pull configuration
scrape_configs:
  # EMQX monitoring
  - job_name: 'emqx'
    metrics_path: /api/v5/prometheus/stats
    scrape_interval: 5s
    honor_labels: true
    static_configs:
      # EMQX IP endpoint
      - targets: [127.0.0.1:18083]
  - job_name: 'node-exporter'
    scrape_interval: 5s
    static_configs:
      # node-exporter IP endpoint
      - targets: ['127.0.0.1:9100']
        labels:
          instance: dashboard-local
On the above configuration, job_name is the task name of data collection, static_configs is the data collection target, targets is the target data collection address, and 127.0.0.1:18083 is the endpoint of EMQX 5.0 API service.
Ultimately, we save the above configuration file content as prometheus.yaml and copy it to the /etc/prometheus/ directory or store it in the custom path where you need to keep the file. At this point, we have completed the simple configuration of Prometheus.
Start Prometheus
After completing the configuration of Prometheus, we can start the Prometheus service by using the file. If you have downloaded the Prometheus image using Docker, you can start Prometheus with the following command:
docker run -d --name prometheus -p 9090:9090 -v /path/to/your/prometheus.yaml:/etc/prometheus.yaml prom/prometheus --config.file=/etc/prometheus/prometheus.yaml
If you install Prometheus by other methods, you can specify the configuration file path when running Prometheus, for example:
./prometheus --config.file=prometheus.yml
Note: When using the configuration file, you need to replace
/path/to/your/prometheus.yamlwith the actual path where you store the Prometheus configuration file.
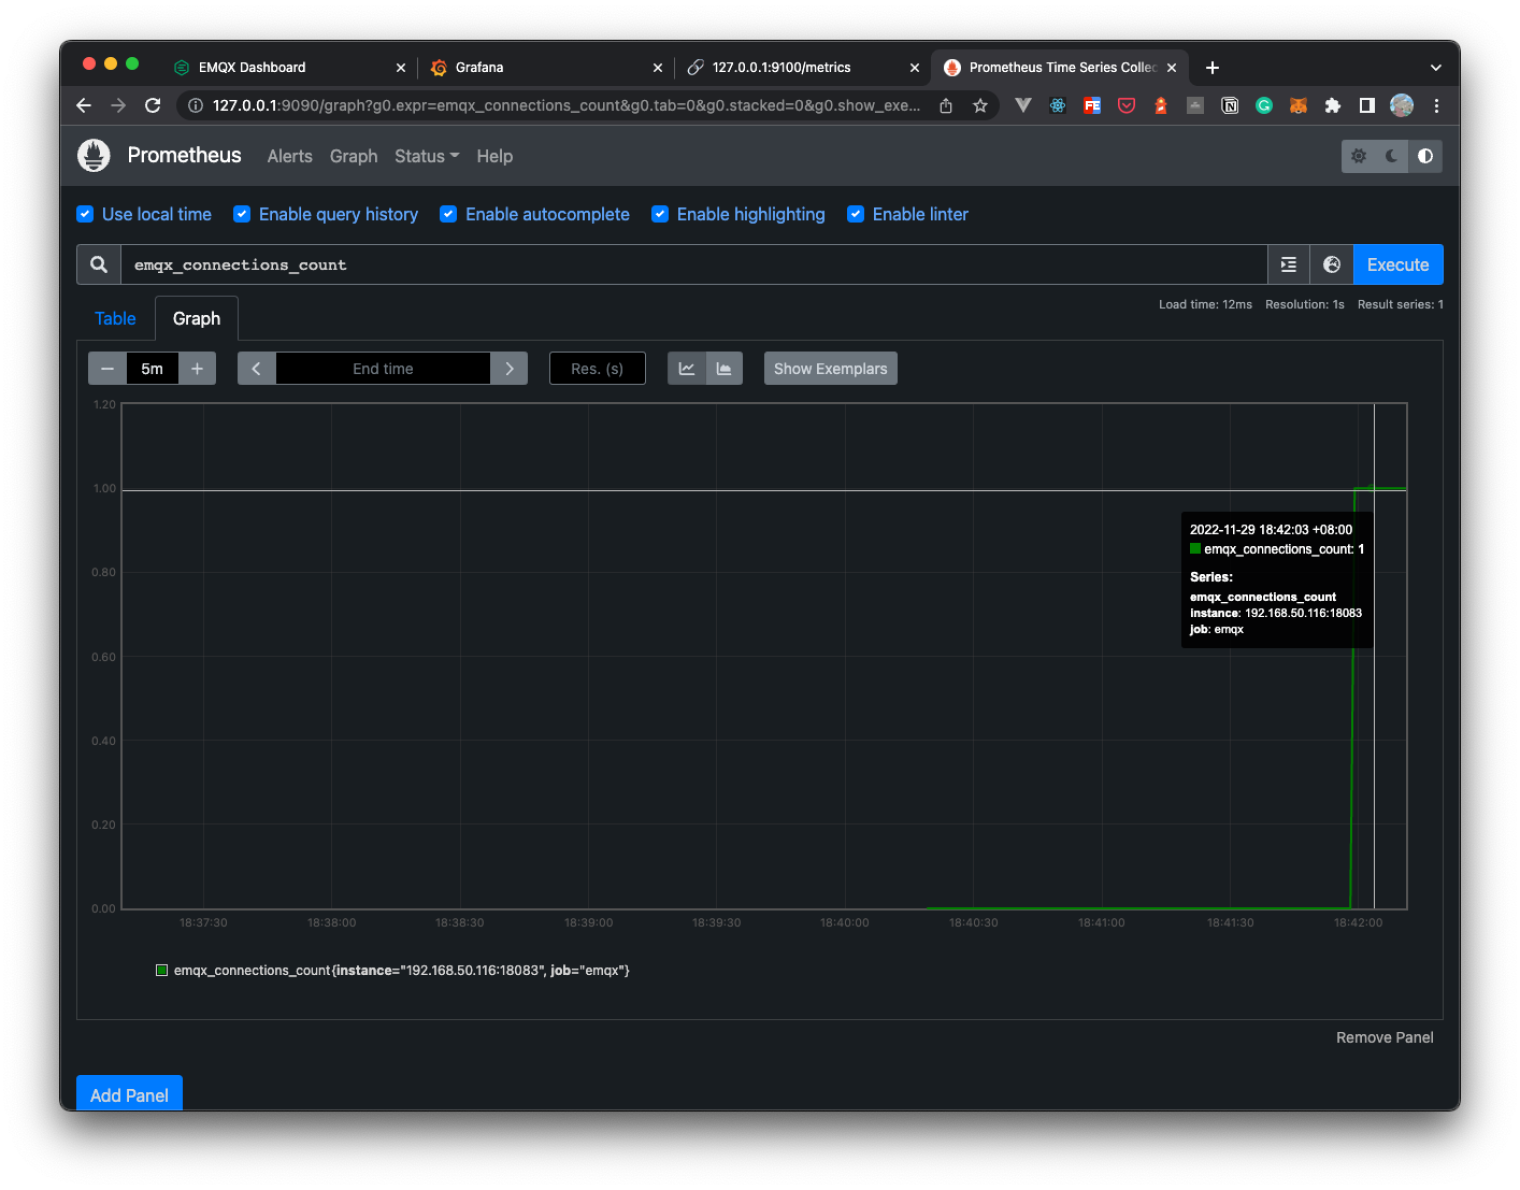
If successful, you can access the Prometheus Dashboard by opening http://localhost:9090. Through the Dashboard, you can view the running status of Prometheus and search for EMQX's monitoring data by entering emqx. If the data is displayed usually, it means that Prometheus has successfully started and collected EMQX's monitoring data.
About Pushgateway
In addition to specifying the data collection metrics using the API configuration file containing EMQX, EMQX also supports using Pushgateway to collect data metrics.
Pushgateway is a component of Prometheus that is used to store data metrics temporarily, and then Prometheus pulls data metrics from Pushgateway.
We do not need to use the Pushgateway service because EMQX supports getting data metrics through the API. Suppose you blindly use PushGateway to get data. In that case, you may encounter some problems, such as: when Pushgateway monitors multiple instances, Pushgateway will become a single point of failure, Pushgateway will not discard or delete its Series, and will continue to expose it to Prometheus, and so on.
But in some cases, we may need to use Pushgateway to collect data metrics.
For example: when the EMQX service runs in Docker containers or Kubernetes clusters, we can use Pushgateway to collect data metrics instead of exposing the EMQX API to the external network. And usually, the only valid use case for Pushgateway is to capture the results of service-level batch jobs. Click to view and learn more about When to use Pushgateway.
Using Docker to install the Pushgateway service:
docker run -d --name pushgateway -p 9091:9091 prom/pushgateway
For more about installing and using Pushgateway, please refer to Pushgateway Installation Document. At this point, we can access the Pushgateway Dashboard by http://localhost:9091.
EMQX Provides an API for configuring the Pushgateway service, which can report the data metrics of EMQX through the configuration to the service address of Pushgateway and finally be pulled by Prometheus from Pushgateway. At the same time, you can also configure the service address of Pushgateway directly in the EMQX Dashboard, enter the completion, and click Update.
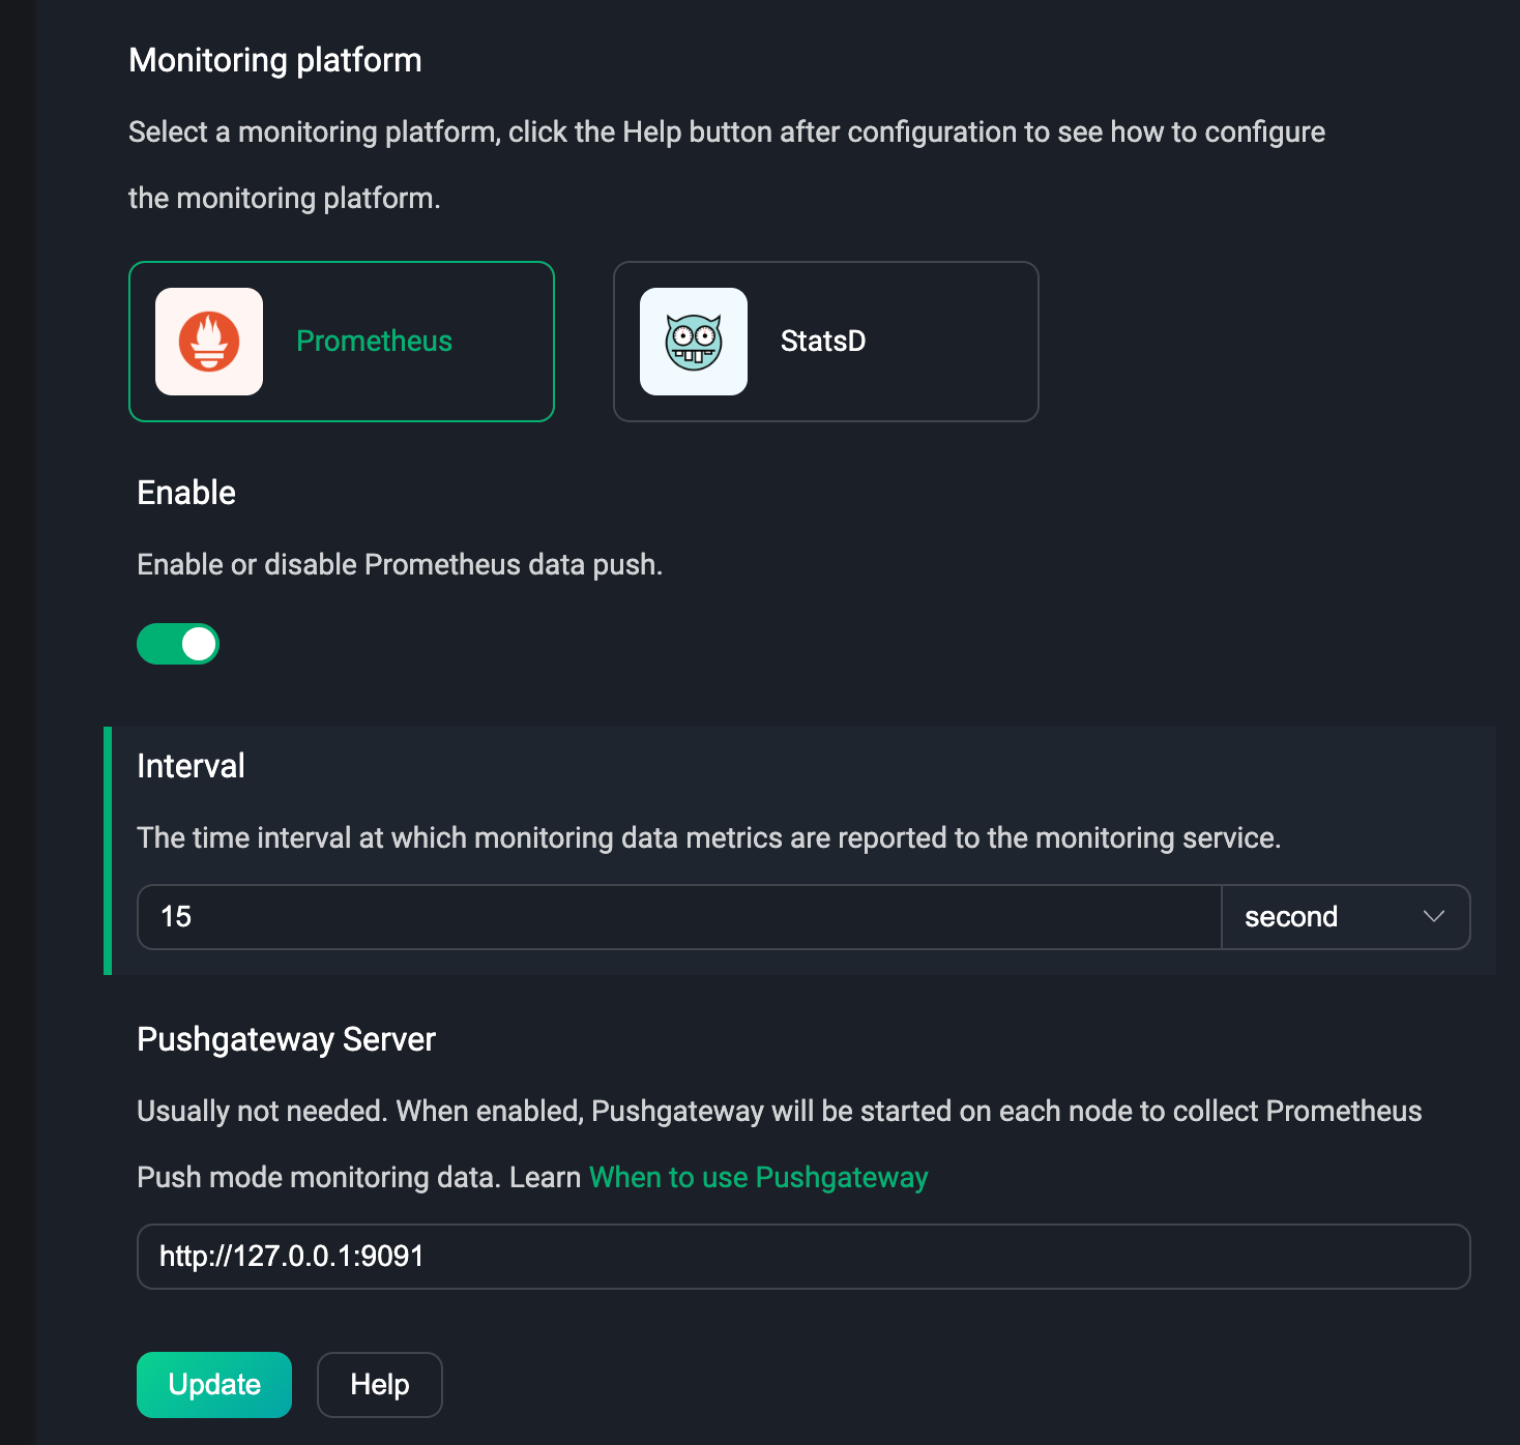
In using Pushgateway, you need to add the following configuration to the scrape_configs section of the Prometheus configuration file:
Note: On the configuration, the
targetsneed to be replaced with your actual Pushgateway service endpoint.
# EMQX Pushgateway monitoring
- job_name: 'pushgateway'
  scrape_interval: 5s
  honor_labels: true
  static_configs:
    # Pushgateway IP endpoint
    - targets: ['127.0.0.1:9091']
After completing the configuration, you can start the Prometheus service by using the configuration file in the same way as the above operation to create Prometheus. This completes the monitoring configuration of EMQX.
After completing the configuration of using Prometheus to collect data metrics of EMQX, we can use Grafana to visualize the monitoring of EMQX's metric data. In the above steps, we have successfully opened the Web console of Grafana. For the first time using Grafana, the default account and password are admin. After logging in successfully, we can add the data source.
Prometheus as a Data Source
Using Grafana, you can use Prometheus as a data source. The steps to add Prometheus as a data source are as follows:
Click the
Configurationon the left, then clickData Sourcesto enter the data source configuration page;Click
Add data sourceand selectPrometheus;In the
HTTPconfiguration, enter the address of the Prometheus service, for example,http://127.0.0.1:9090;Finally, click
Save & Test. If the configuration is correct, it will displayData source is working, which means the configuration is successful.
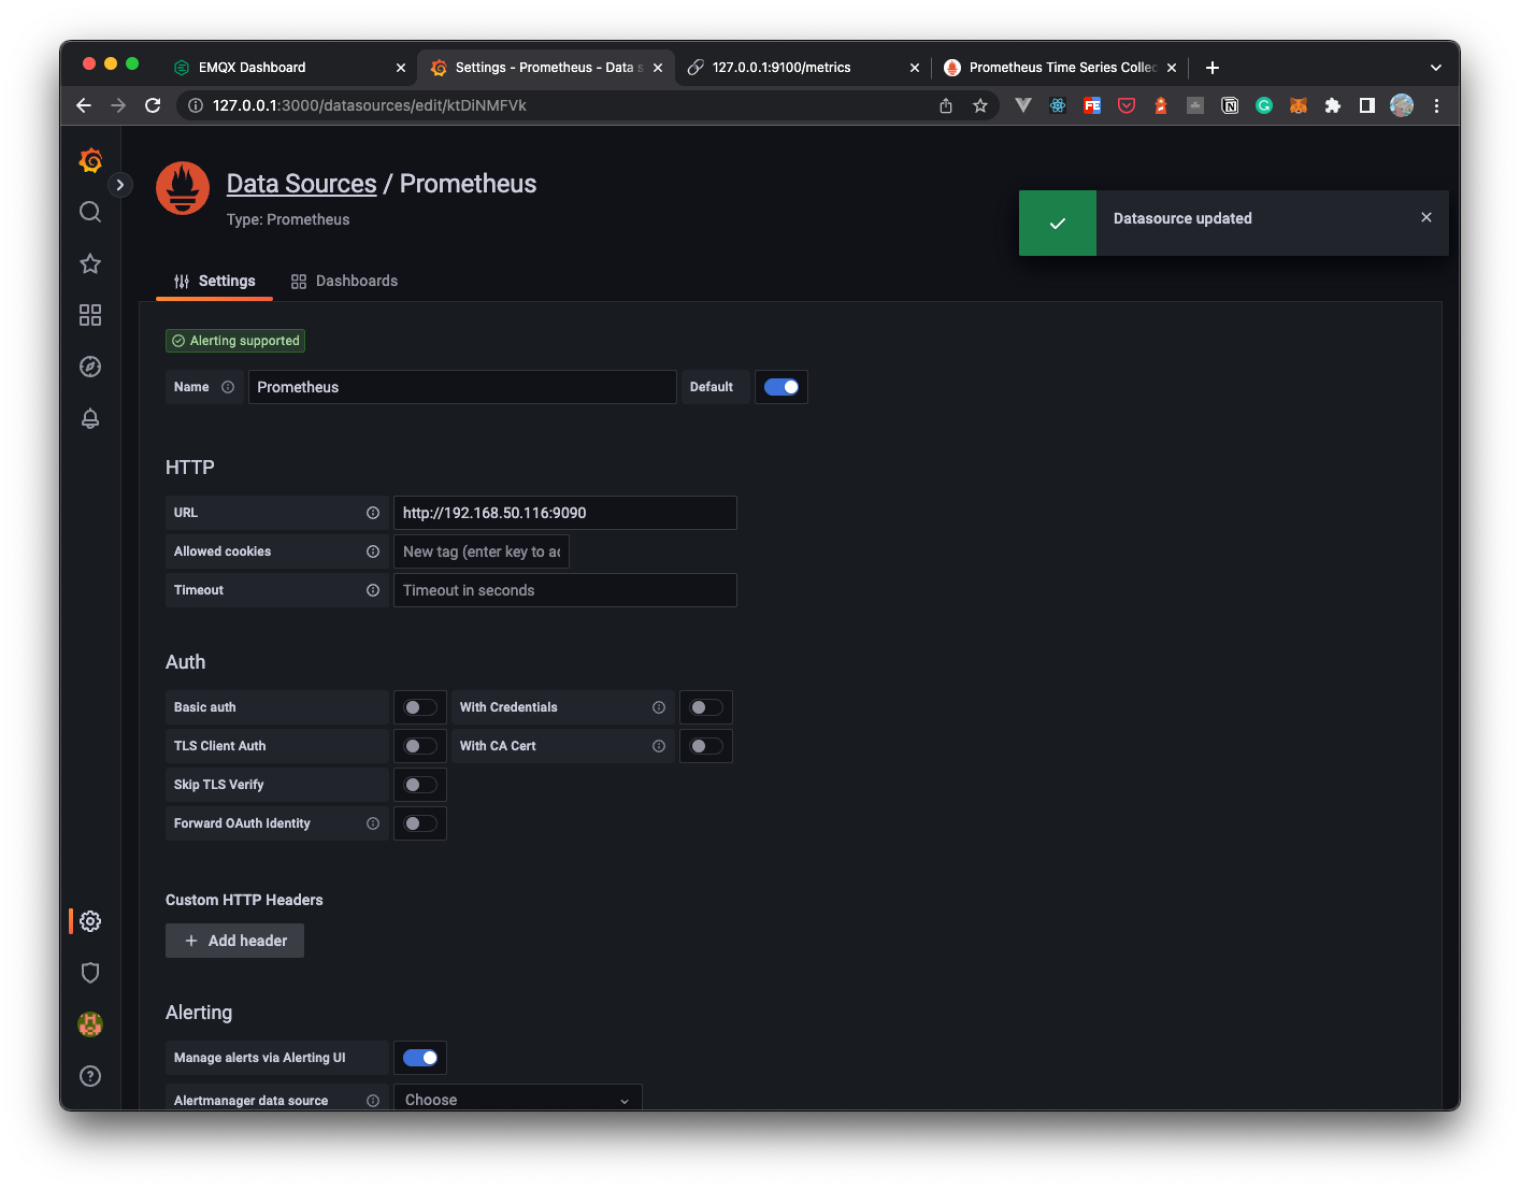
After the configuration is completed, we can use Prometheus as a data source to get monitoring data in Grafana. Next, we can continue to add the Dashboard template to visualize the monitoring of EMQX's data metrics. You can also manually create a Dashboard and add charts according to your needs.
Import Dashboard
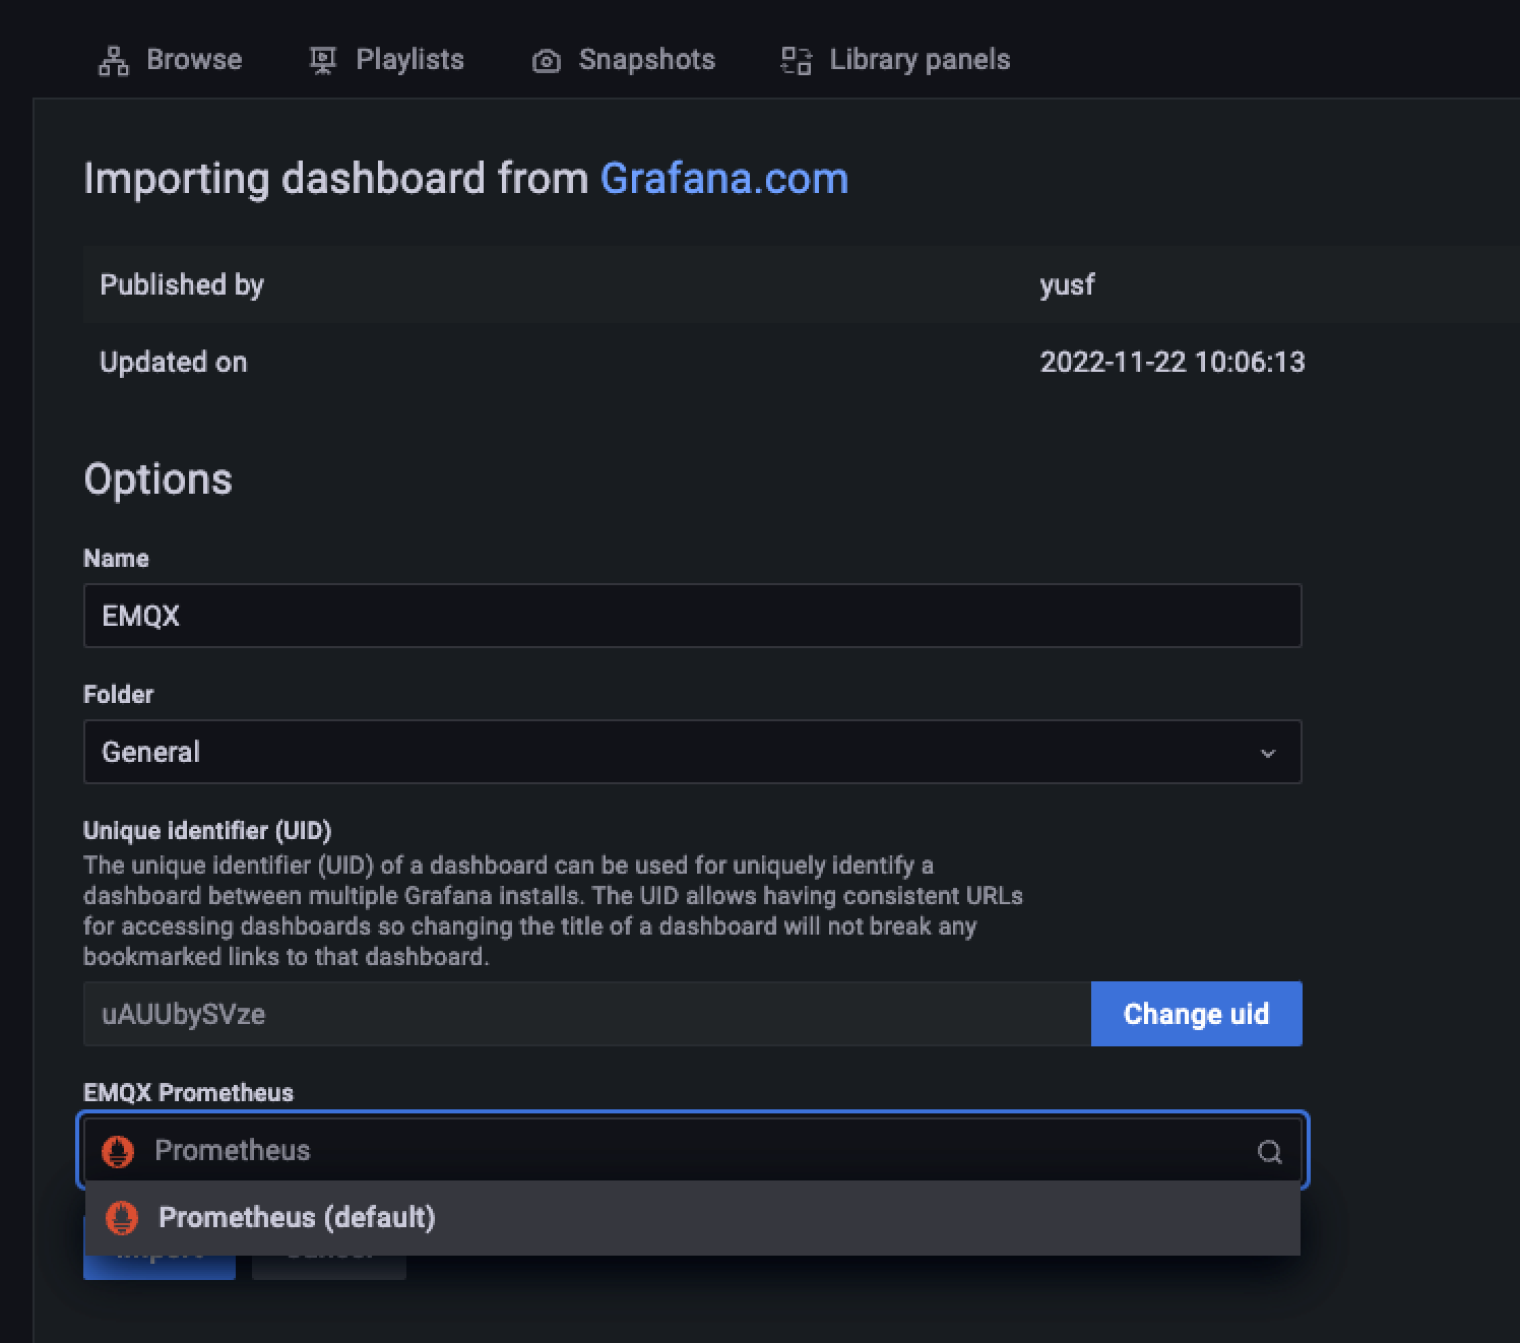
We provide a default Grafana Dashboard template that You can directly import into Grafana and select the newly created Prometheus data source. After the import is successful, open the Dashboard panel, and you can see the monitoring data of EMQX.
You can download default Dashboard templates from EMQX | Grafana Dashboard, or you can click the Download button on the help page of the configuration page of EMQX Dashboard's Monitoring Integration.
The specific import steps are as follows:
- Click
Importon the left to enter the page for importing Dashboard;
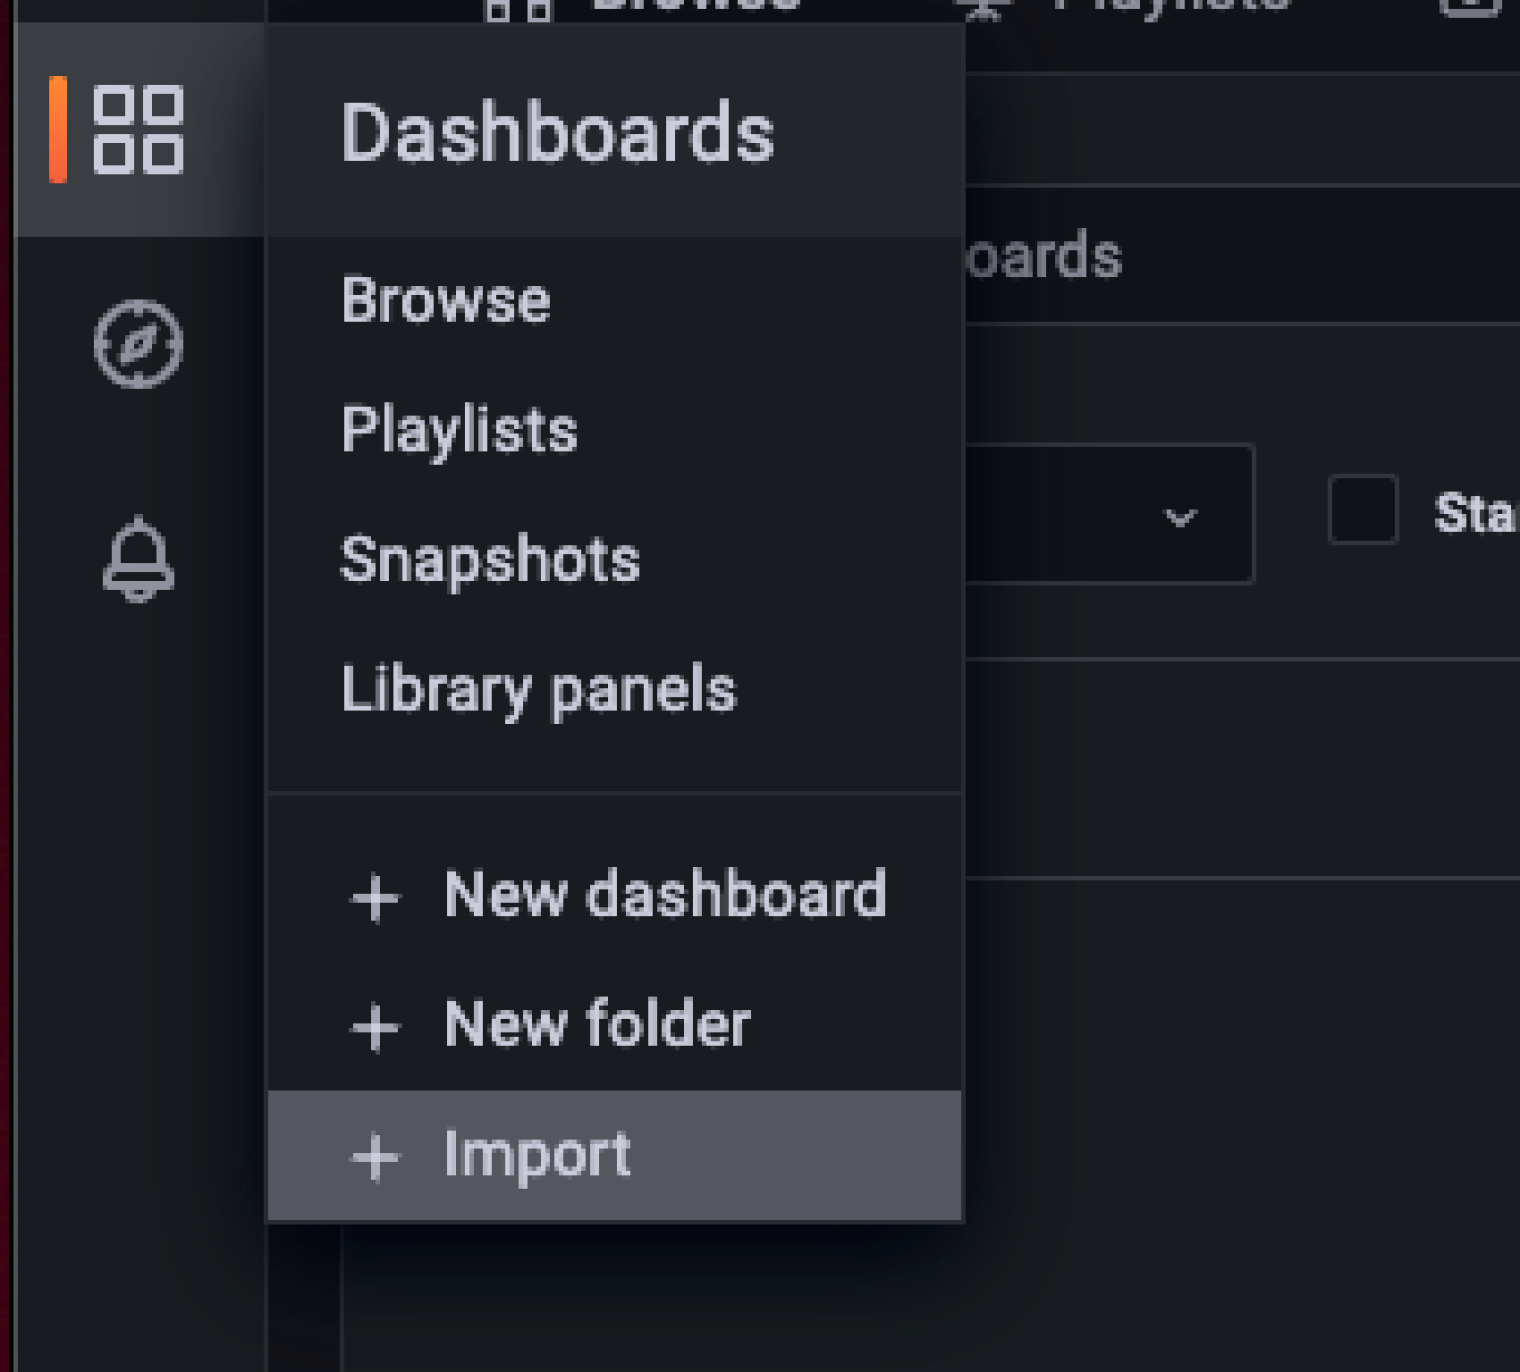
- Click
Upload JSON fileand select the Dashboard template that was just downloaded, or directly enter the EMQX | Grafana Labs address in the input box under theImport viagrafana.comcolumn;
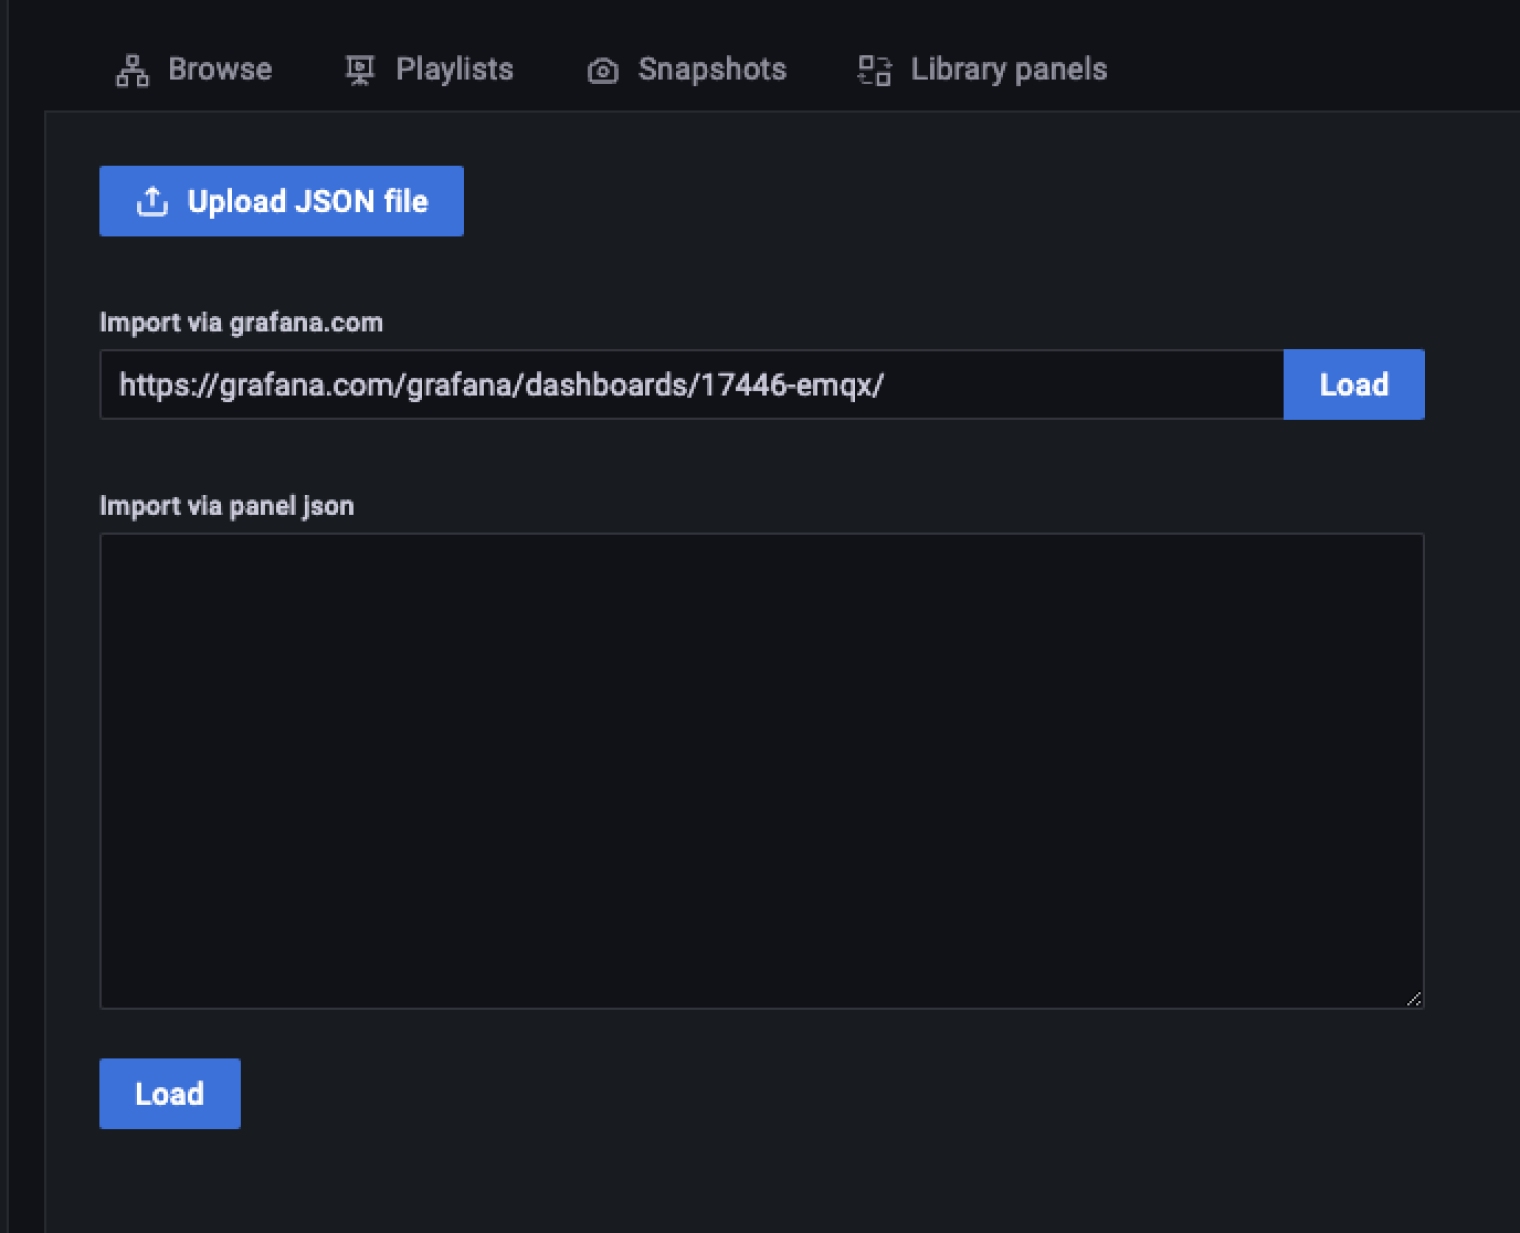
- Click
Loadand select the newly created Prometheus data source, and then clickImportto import the Dashboard template.
After importing the Dashboard template, you can see the monitoring data of EMQX in the monitoring panel, as shown in the following figure:
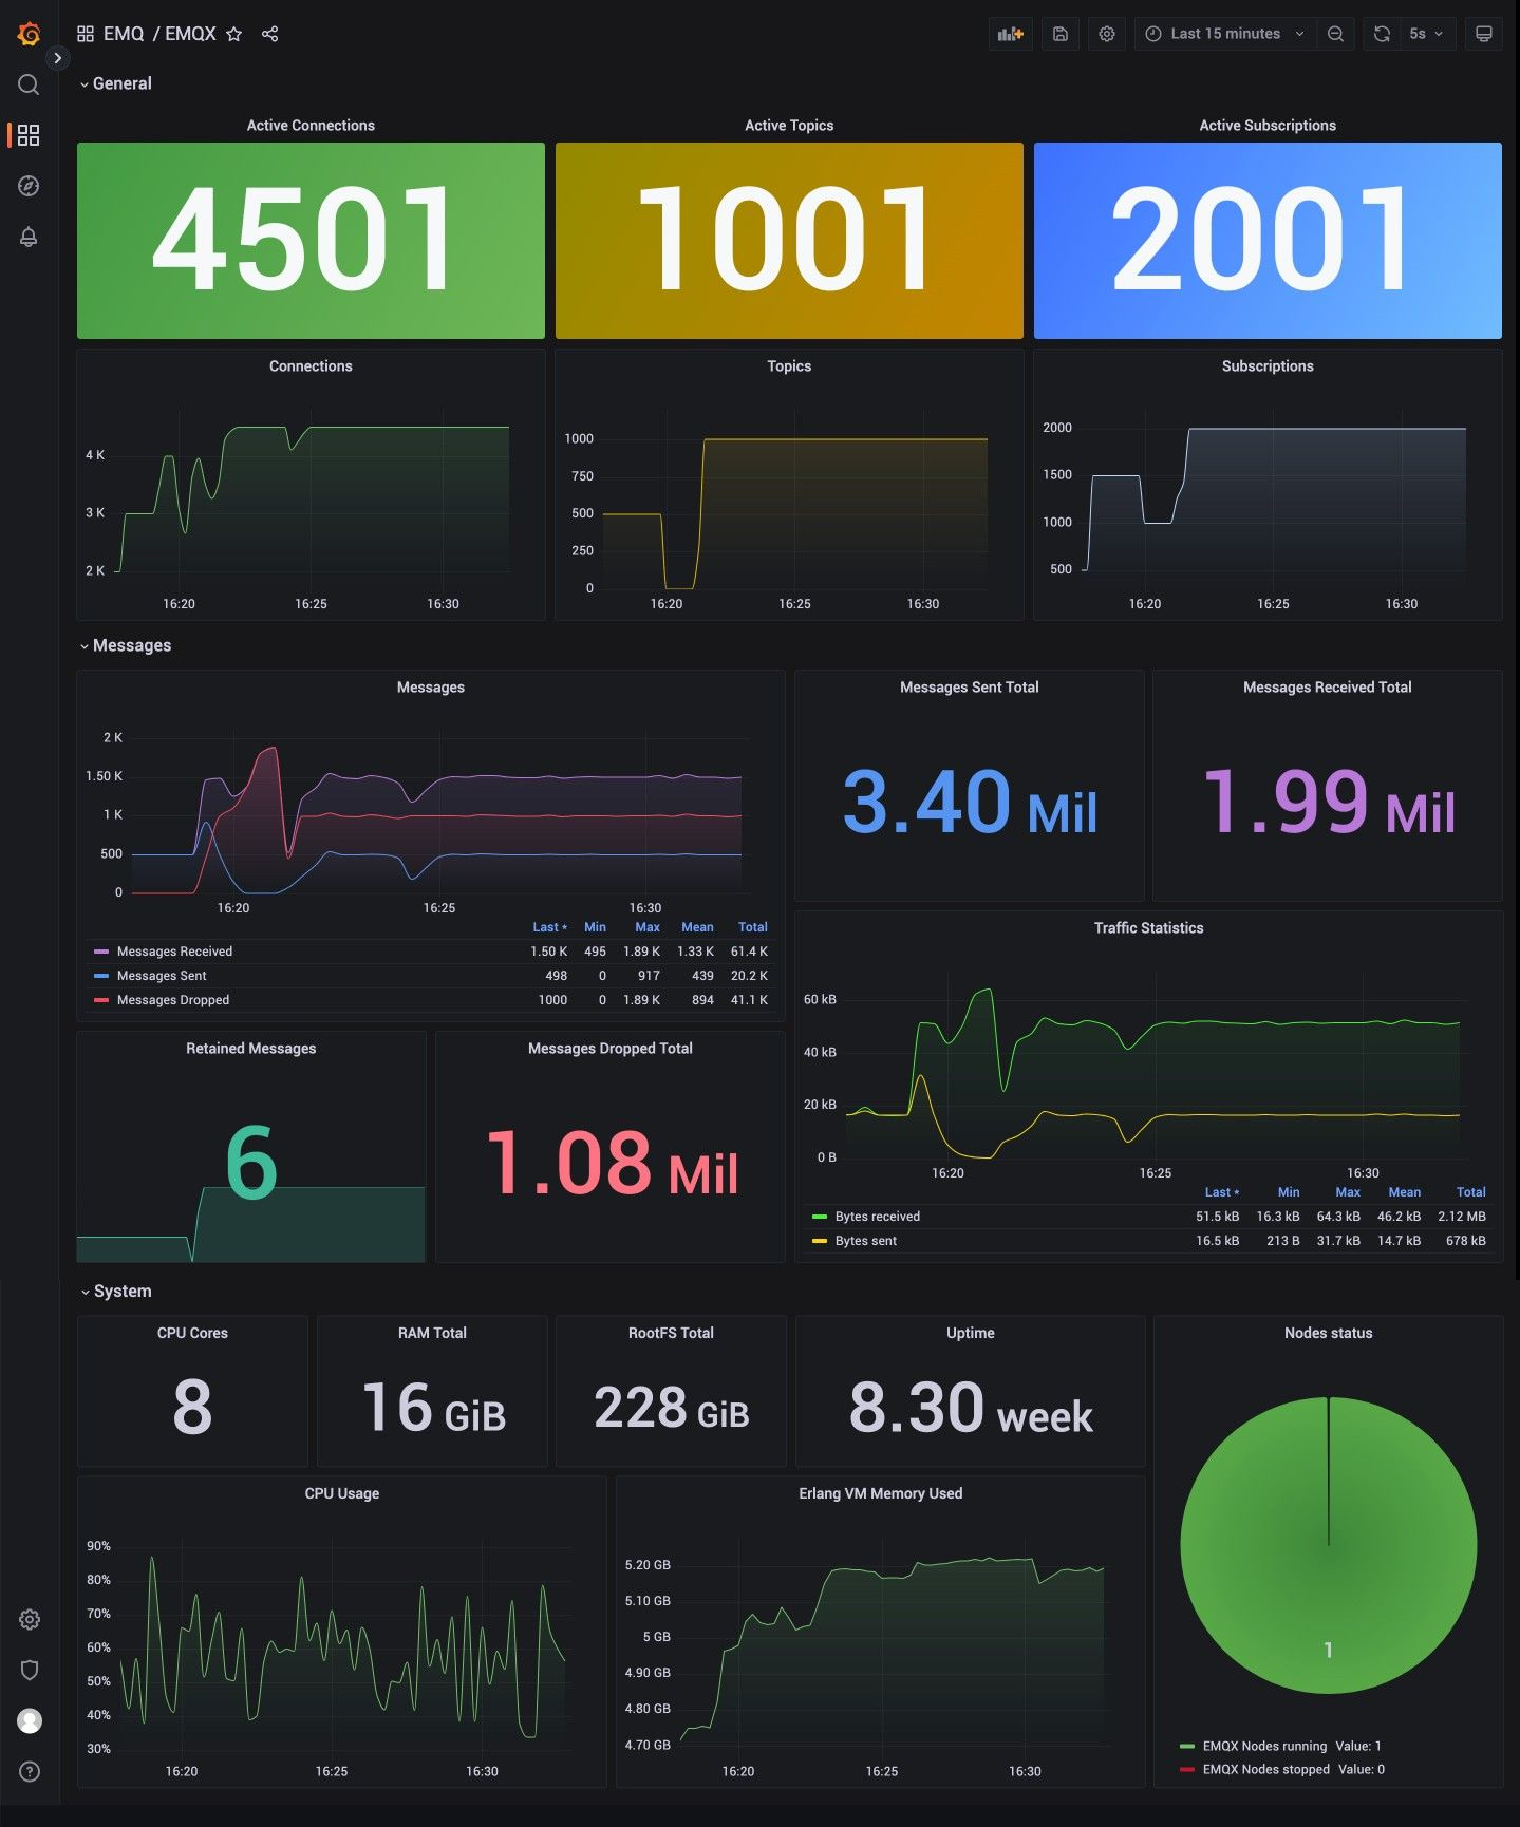
Note: By default, the template will monitor the metric data of the entire EMQX cluster.
Metrics Displayed:
General, including the number of connections, topics, and subscriptions.
Messages include the number of messages published and received and the number published and received per second.
System, including the number of processes, CPU and Erlang VM memory, etc.
Packet, including the number of boxes connected, published, received, etc.
Users can also customize the Dashboard based on the default template, add their metrics or modify the style of the chart, etc. For specific operation steps, please refer to Grafana Official Document.
How to Configure in EMQX Dashboard
The EMQX version used in this article is 5.0.11. You can also get more monitoring integration operation information from this version by clicking the "Help" button on the Configuration -> Monitoring -> Integration page in the EMQX Dashboard.
On the help page, you only need to install the Prometheus and Grafana services according to the step prompts and then fill in some vital configuration information in the configuration items.
Such as the endpoint of EMQX, the API for obtaining metric data, etc. Click the Generate button to generate and download the configuration file automatically, and finally, you can download the default Grafana Dashboard template.
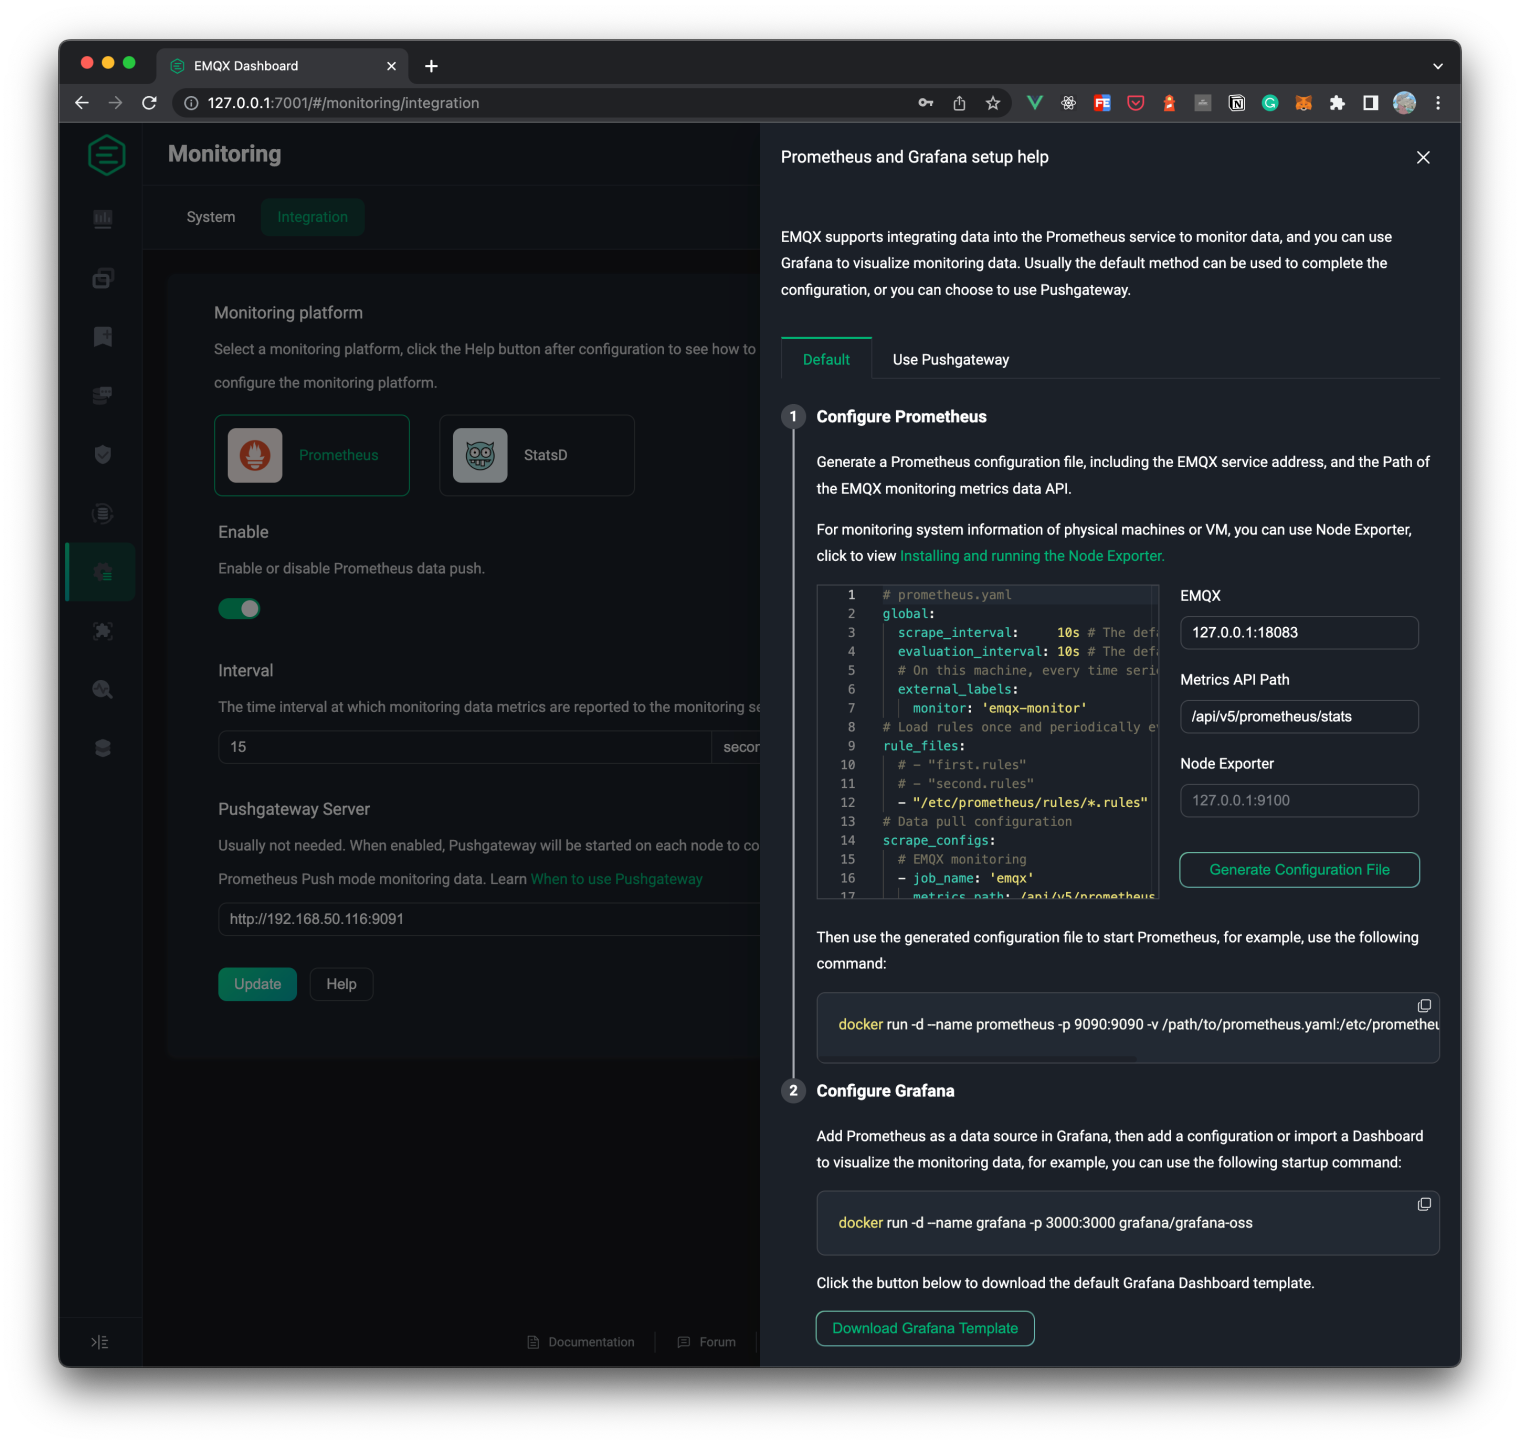
In the same way, the help can be divided into two configuration modes: default and using Pushgateway. In the configuration mode using Pushgateway, you can open the switch on the page, enter the address of Pushgateway and the time to report the data, and click Save to complete the configuration after saving.
For more about configuring the integration of Prometheus in Dashboard, you can refer to the EMQX Dashboard Configuration Monitoring Integration document.
Conclusion
This article briefly introduces how to use Prometheus to collect the data metrics of EMQX and then use Grafana to visualize the monitoring of EMQX's data metrics. After EMQX 5.0.11, you can also get more monitoring integration operation information by clicking the "Help" button on the Integration page in the EMQX Dashboard.
Originally published at https://www.emqx.com.
